EcommerceDDD++: Distributed Observability with OpenTelemetry
EcommerceDDD++ is a companion series to the original six-part series — each post covers a meaningful improvement or addition to the EcommerceDDD project that didn’t fit neatly into the original arc.
When you build a distributed system like that, debugging becomes a different kind of challenge. An order fails, but where? In the API? In the Kafka consumer? In a downstream service processing the payment?
Without proper observability, you’re left reading isolated log files from multiple containers, manually correlating timestamps, hoping for the best.
The setup described here is a pragmatic fit for the EcommerceDDD architecture — custom CommandBus, Marten event sourcing, transactional outbox via Debezium CDC — and is meant to demonstrate the shape of cross-service tracing rather than a one-size-fits-all template. Different stacks (MediatR, MassTransit, native Kafka producers, OTel auto-instrumentation only) will reach the same outcome through different mechanisms.
What is in scope: trace propagation across HTTP, custom CommandBus, transactional outbox + CDC, Kafka consumers, and structured logs/metrics correlated to those traces.
What is out of scope: sampling strategy, OTel Baggage propagation, custom domain metrics (e.g. orders/minute), retry/DLQ tracing semantics, and production-grade backends with retention. Each of those deserves its own post.
The three pillars of observability
OpenTelemetry defines three signals that together give you a complete picture of a running system:
- Traces: the end-to-end journey of a request, broken into spans. Each span represents a unit of work with a
start time,duration, andattributes. - Metrics: numeric measurements over time:
request rates,error counts,latency percentiles,memory usage. - Logs: structured text events emitted by your application, correlated to a trace when possible.
In a microservices architecture like EcommerceDDD, where a single customer action triggers activity across multiple services, Kafka topics, and PostgreSQL outbox writes — traces are the most valuable signal. They let you follow a request across service boundaries as a single, coherent picture.
Setting up the pipeline
All microservices in this project share the same infrastructure via EcommerceDDD.Core.Infrastructure. The entire OTel setup lives in a single extension method:
A few important design decisions here:
.ConfigureResource()is called once and shared across all three pillars. This ensures all signals carry the sameservice.nameandservice.versionattributes without duplication..AddNpgsql()(from theNpgsql.OpenTelemetrypackage) instruments every database query automatically. You get the duration and database metadata, and the query is attached to the active trace as a child span — no manual work required..WithLogging()wires structured logs into the OTLP pipeline. Logs emitted byILogger<T>are exported alongside traces and metrics, and when emitted within an active span, they carry theTraceIdandSpanIdautomatically.- Custom
ActivitySourcenames (EcommerceDDD.CommandBus,EcommerceDDD.Kafka.Consumer, andEcommerceDDD.Outbox.Write) are registered here via the constants inActivitySources.cs. Unless you register a source with.AddSource(), its spans are silently dropped.
In practice, most services register observability indirectly through AddCoreInfrastructure, which resolves the service name from the entry assembly automatically:
1
2
3
// CoreInfrastructureExtensions.cs
var serviceName = Assembly.GetEntryAssembly()?.GetName().Name ?? "Unknown";
services.AddOpenTelemetryObservability(serviceName);
Services that need an explicit name due to not using the CoreInfrastructureExtensions, like the API Gateway, which sits outside the standard service pattern, can call it directly:
1
builder.Services.AddOpenTelemetryObservability("EcommerceDDD.ApiGateway");
The Aspire Dashboard as a collector
This project uses the .NET Aspire Dashboard as a standalone OTLP collector and UI. It’s a single Docker container that accepts traces, metrics, and logs over OTLP/gRPC.
1
2
aspire-dashboard:
  image: mcr.microsoft.com/dotnet/aspire-dashboard:9.1
Each service sends telemetry to it via the standard OTLP endpoint:
1
2
environment:
  OTEL_EXPORTER_OTLP_ENDPOINT: 'http://aspire-dashboard:18889'
The dashboard is accessible at http://localhost:18888 and requires no additional configuration. It’s a pragmatic choice for development: lightweight, zero-config, and purpose-built for .NET.
What the Aspire Dashboard is — and isn’t.
It’s a real-time visualizer for active development sessions: you trigger an operation, and within seconds you can see the full trace, correlated logs, and metrics all in one place. That’s its strength.
What it is not is a telemetry backend. All data is stored in memory with a finite buffer (10,000 telemetry items by default). As new telemetry arrives from the running services, older entries are evicted. A deep-link to a specific order.id trace that worked during a debugging session will return “No traces found” once that trace has been pushed out of the buffer, even without a container restart.
⚠️ For persistent storage with historical trace lookup, log retention across sessions, or anything beyond active debugging, you would need a dedicated backend such as Jaeger or Grafana Tempo for traces, and Seq or Loki for logs.
The OTLP exporter is protocol-agnostic: adding a second backend is a configuration change, not a code change.
Tracing exceptions
By default, unhandled exceptions do not mark a trace span as errored — that’s opt-in behavior in OTel. The GlobalExceptionHandler centralizes this:
There are two distinct cases:
- 5xx errors (unhandled exceptions): the span is marked as
Error, the full exception stack is attached viaAddException, and the log entry carriesLogLevel.Error. This makes the span appear red in the dashboard with a complete stack trace attached. - 4xx errors (domain validation, business rules): the span status is set to
Erroras well, butAddExceptionis not called and the log level isWarning. A domain rule violation like “insufficient funds” is a business event, not a crash — it should be observable but not alarming.
⚠️ Design note: marking 4xx as ActivityStatusCode.Error is a deliberate choice, not the only valid one. The OTel spec leaves this decision open: some teams prefer to reserve Error exclusively for 5xx and treat 4xx as Unset (the default), arguing that client errors are expected outcomes rather than server failures. The approach here favors visibility — every exception that surfaces to the user is reflected in the trace — which is reasonable for a development and debugging context.
Importantly, traceId is included in every error response body. When a user reports an error, you have the exact trace identifier to look up in the dashboard immediately.
Tracing commands
In EcommerceDDD, every user action and integration event eventually routes through CommandBus.SendAsync. Placing telemetry here gives you a span for every command dispatched in the system, named after the command type, without touching individual handlers.
Each span is named after the command type (PlaceOrder, ProcessOrder, RequestPayment, etc.), making the trace timeline readable at a glance. Both paths to failure are covered: unhandled exceptions attach the full stack trace via AddException, and Result.IsFailed marks the span as errored even when no exception was thrown — for example, when a business rule returns Result.Fail("...") from a handler.
Tagging business context
Tags attached to a span belong exclusively to that span — they are not inherited by child spans. Each Activity is an independent object. Npgsql query spans, HttpClient spans, and any other spans created within the same execution appear as children in the trace hierarchy, but they do not automatically carry tags from the parent.
To make order.id searchable across traces without scattering Activity.Current?.SetTag(...) calls into every handler, the project uses a dedicated ITraceable interface:
Commands that carry a known OrderId implement it:
CommandBus applies the tags automatically, but only when there is an active span — avoiding unnecessary allocation when the span is dropped by the sampler.
Commands that don’t participate in tracing implement only the ICommand interface without tagging logic. Commands where the order.id is not available at dispatch time (because it is generated inside the handler, or fetched from an aggregate) still call Activity.Current?.SetTag(...) directly inside the handler. PlaceOrder is the clearest example: the order ID only exists after Order.Place() runs, so the handler tags the span at that point.
This design keeps ICommand as a pure dispatch contract, separates the observability concern into its own interface, and ensures the CommandBus remains the single point of span enrichment. It is one pragmatic shape for this project — pipelines like MediatR’s IPipelineBehavior or interceptor-based stacks would reach the same result with different plumbing.
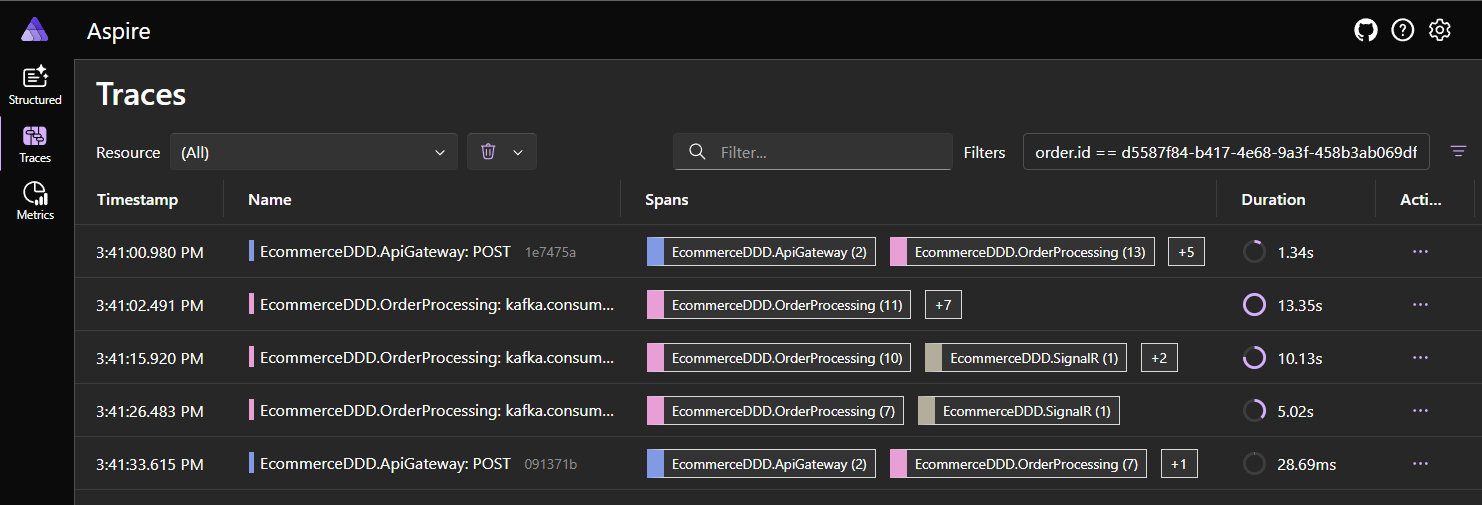
In the Aspire Dashboard you can filter the trace list by order.id:equals:{guid} to find every trace that touched a specific order, across all services. Each service’s command spans carry this tag because every command that handles an order-scoped operation implements ITraceable.
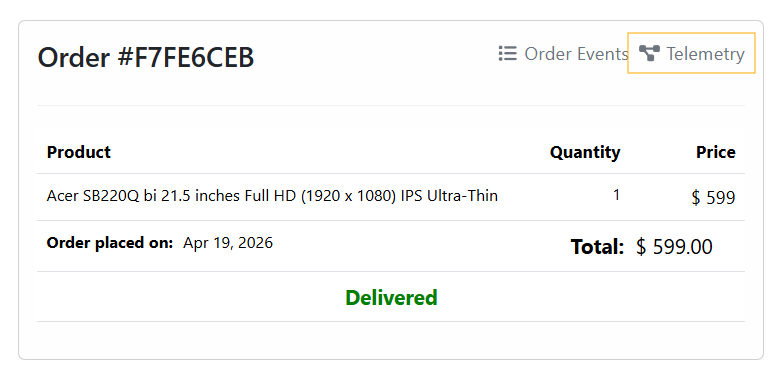
The Angular SPA uses this filter to generate a deep-link from the Orders component directly to the order’s trace:
1
2
3
4
getAspireTraceUrl(orderId: string): string {
    const filter = encodeURIComponent(`order.id:equals:${orderId}`);
    return `${environment.aspireDashboardUrl}/traces?filters=${filter}`;
}
Tracing the outbox write
EcommerceDDD uses the Transactional Outbox Pattern: integration events are persisted to PostgreSQL in the same transaction as the domain events, then relayed to Kafka via Debezium CDC. I wrote about this kind of implementation in depth in this post. This means the “produce to Kafka” action is actually a database write, and the real producer is the Marten IDocumentSession.
The challenge with tracing this is that the intent (preparing the integration event) and the actual persistence (SaveChangesAsync) happen in two separate method calls on the same repository. A naive using var activity in the first method would close the span before the database write occurs, producing misleading telemetry.
One pragmatic solution for this project’s architecture was to use an instance field to bridge the span’s lifetime across both calls:
The span is opened when the outbox payload is staged and closed (via Dispose()) only after SaveChangesAsync completes. Because the span is active during the await, the Npgsql instrumentation will automatically attach the SQL query spans as children. You end up with a producer span that accurately represents the full duration of “intent to persist” → “data in the database”.
⚠️ Because this approach relies on a mutable instance field, MartenRepository must be registered as scoped (per-request) in DI. A singleton registration would race across concurrent requests and produce nonsense traces. Other valid approaches include passing the activity explicitly through method parameters or using AsyncLocal<T> — the instance field is the simplest given the existing scoped-repository pattern.
There is also a subtle but critical piece: IntegrationEvent.TraceContext:
Activity.Current?.Id is the W3C traceparent string of the active producer span. This value is stored as a column on the outbox record — not as a Kafka message header — because Debezium’s PostgreSQL connector publishes the row’s data verbatim and does not synthesize Kafka headers from arbitrary application context. Putting TraceContext in the payload itself is what makes it survive the CDC hop. The consumer reads it back to reconnect the trace on the other side of the queue.
In setups where you produce to Kafka directly from the application (no CDC), the idiomatic approach is to inject traceparent as a Kafka header via OTel’s standard Propagators.DefaultTextMapPropagator. Both achieve the same outcome; the choice is dictated by who actually publishes to Kafka.
Tracing the Kafka consumer
When a Kafka consumer picks up a message, it starts a new trace, but it carries a link to the producer trace via the TraceContext field extracted from the message payload:
1
2
3
4
5
6
7
8
9
10
11
12
13
14
15
16
17
18
19
20
21
22
23
24
25
26
27
// Extract W3C trace context stored in the outbox payload
var jsonObject = JObject.Parse(result.Message.Value);
var traceParent = jsonObject["TraceContext"]?.ToString();

// Per OTel Messaging spec, async consumer spans use ActivityLink
// instead of parent-child to avoid collapsing producer and consumer into one trace.
ActivityLink[] links = [];
if (!string.IsNullOrEmpty(traceParent) &&
    ActivityContext.TryParse(traceParent, null, isRemote: true, out var producerContext))
{
    links = [new ActivityLink(producerContext)];
}

using var activity = _activitySource.StartActivity(
    $"kafka.consume {result.Topic}",
    ActivityKind.Consumer,
    parentContext: default,
    tags: null,
    links: links);

activity?.SetTag(MessagingAttributes.AttributeMessagingSystem, MessagingAttributes.MessagingSystemValues.Kafka);
activity?.SetTag(MessagingAttributes.AttributeMessagingDestinationName, result.Topic);
activity?.SetTag(MessagingAttributes.AttributeMessagingOperationType, MessagingAttributes.MessagingOperationTypeValues.Receive);
activity?.SetTag(MessagingAttributes.AttributeMessagingConsumerGroupName, _config.Group);
activity?.SetTag(MessagingAttributes.AttributeMessagingDestinationPartitionId, result.Partition.Value);
activity?.SetTag(MessagingAttributes.AttributeMessagingKafkaOffset, result.Offset.Value);
activity?.SetTag(MessagingAttributes.AttributeMessagingKafkaMessageKey, result.Message.Key);
The key design here is parentContext: default combined with links. The OTel Messaging specification distinguishes between synchronous messaging (parent-child relationship) and asynchronous messaging (linked traces). Using a parent-child relationship across a Kafka topic would collapse all downstream processing into the original HTTP trace, making it impossible to understand what happened after the message was published. The ActivityLink instead provides a navigable reference between the two traces without merging them.
A note on attribute constants
Both MessagingAttributes (Kafka tags) and TelemetryTags (domain tags like order.id) are local constant classes in this project. The official OTel OpenTelemetry.SemanticConventions NuGet package ships these names as constants but is still in pre-release (-rc/-alpha) and the surface keeps shifting between releases. Defining a thin local set of constants keeps the codebase decoupled from that churn while still emitting the current spec-compliant attribute names (messaging.destination.name, messaging.consumer.group.name, etc.). When the package stabilizes, swapping the constants out is a mechanical change.
Following an order end-to-end
With all signals in place, let’s follow what happens when a customer places an order and payment fails due to insufficient funds.
Step 1 — HTTP request arrives via ApiGateway, routed to OrderProcessing
The ASP.NET Core instrumentation at the ApiGateway creates the root span for the POST /api/v2/orders request, then OrderProcessing continues that trace as the request is forwarded. Once inside OrderProcessing, the CommandBus creates a child span named PlaceOrder, which tags order.id on the active activity. All work within the handler — including the Marten AppendEventsAsync call that persists the OrderPlaced domain event and the outbox entry — becomes a child of this span. The TraceContext field in the outbox record carries the current TraceId forward to Step 2.
Step 2 — Debezium reads the outbox, publishes to Kafka
Debezium reads the integration_events table and publishes the payload (including TraceContext) to the Kafka topic. This happens outside the application process and there is no span here, but the TraceContext survives in the message payload.
Step 3 — PaymentProcessing consumer picks up the message
The consumer extracts TraceContext, creates a new root trace with ActivityLink pointing back to Step 1. The payment handler validates customer credit via CustomerManagement and checks product availability via InventoryManagement, then appends a domain outcome event — PaymentFinalized on success, or one of CustomerReachedCreditLimit / ProductWasOutOfStock on failure — to the outbox. The outbox write captures the new TraceContext for Step 4.
Step 4 — OrderProcessing reacts to payment outcome
Another consumer span starts in OrderProcessing linked to Step 3. The order status is updated and a SignalR notification is dispatched to the frontend.
In the Aspire Dashboard, each step is a separate trace, but the ActivityLink references connect them. You can navigate from the OrderProcessing trace (Step 1) → PaymentProcessing trace (Step 3) → back to OrderProcessing (Step 4), following the full business flow across service boundaries. Keep in mind that this navigation only works while all linked traces are still in the dashboard’s in-memory buffer — once any of them is evicted, the link becomes a dead end.
For a domain error like “insufficient funds”, no span is red — the payment failure is a known business outcome. The handler cancels the payment aggregate, appends a CustomerReachedCreditLimit integration event to the outbox, and returns Result.Ok(). No exception is thrown, no span status is set to Error. The CustomerReachedCreditLimit event is correctly traced as a successful execution of that business rule, and the OrderProcessing saga reacts to it in Step 4 by issuing a CancelOrder command — which itself implements ITraceable so the order.id tag is preserved across the compensation path.
What you see in the dashboard
Once the stack is running (docker-compose up), open the Aspire Dashboard at http://localhost:18888.
Structured Logs — every ILogger<T> call appears as a structured log entry with the service name, log level, and (when emitted inside a span) the TraceId and SpanId. You can filter by log level, service, or trace identifier.
Traces — each incoming HTTP request, Kafka consume operation, or outbox write is a trace. You can search by TraceId, see all spans within a trace including Npgsql query spans, and click into any span to see its tags and events.
While using the SPA, the previously mentioned shortcut in Orders component will lead to that trace:
Metrics — ASP.NET Core, HttpClient, and .NET runtime metrics are available out of the box: request duration histograms, active connections, GC pressure, thread pool usage.
NuGet packages
The observability packages used are all managed centrally in Directory.Packages.props:
1
2
3
4
5
6
7
8
<ItemGroup Label="Observability">
  <PackageVersion Include="OpenTelemetry.Extensions.Hosting" Version="1.15.0" />
  <PackageVersion Include="OpenTelemetry.Instrumentation.AspNetCore" Version="1.15.0" />
  <PackageVersion Include="OpenTelemetry.Instrumentation.Http" Version="1.15.0" />
  <PackageVersion Include="OpenTelemetry.Instrumentation.Runtime" Version="1.15.0" />
  <PackageVersion Include="OpenTelemetry.Exporter.OpenTelemetryProtocol" Version="1.15.0" />
  <PackageVersion Include="Npgsql.OpenTelemetry" Version="10.0.1" />
</ItemGroup>
⚠️ For Npgsql instrumentation, the correct package is Npgsql.OpenTelemetry, maintained by the Npgsql team and version-aligned with the Npgsql driver. Do not confuse it with OpenTelemetry.Instrumentation.Npgsql from the OTel contrib repository, which has been deprecated.
Final thoughts
Adding OpenTelemetry to a distributed system like this is not optional if you want to understand what’s happening at runtime. The three-pillar setup (traces, metrics, and structured logs) all exported through the same OTLP pipeline, gives you a unified view without maintaining multiple observability backends.
The most important implementation detail in this project is the outbox producer span: keeping it open across AppendToOutbox and AppendEventsAsync ensures that the Npgsql SQL spans are correctly nested inside the producer span, and that TraceContext is captured at the right moment. Get that span lifecycle wrong and the cross-service trace chain breaks silently.
Everything here is a pragmatic shape that fits this codebase — not a prescription. The principles (single source of truth for span enrichment, lifecycle of the producer span matching the actual unit of work, async messaging via ActivityLink, propagation channel dictated by who actually publishes) carry over to any stack; the mechanics will look different in yours.
The Aspire Dashboard is an excellent zero-friction collector for development scenarios. When you’re ready to move to something more production-capable, the OTLP exporter is protocol-agnostic, switching to Jaeger, Grafana Tempo, or Honeycomb is a configuration change, not a code change.
Links worth checking
- OpenTelemetry - What is it?
- OTel Messaging Semantic Conventions
- .NET Aspire Dashboard
- Npgsql OpenTelemetry Tracing
- Marten - .NET Document and Event Store
- Debezium PostgreSQL Connector