EcommerceDDD++: Observing an order end-to-end with OpenTelemetry [2/2]
EcommerceDDD++ is a companion series to the original six-part series. Each post covers a meaningful improvement or addition to the EcommerceDDD project that didn’t fit neatly into the original arc.
In Part 1, I wired traces, metrics and logs into the Aspire Dashboard, tagged every order command and event with order.id, and followed an order through its happy path. This time I’ll look at how its trace crosses the outbox and the Kafka hop, break things on purpose to see what the telemetry shows, and count failures and orders with metrics.
Crossing the outbox boundaries
EcommerceDDD uses the Transactional Outbox Pattern to guarantee the delivery of integration events through Kafka, as I touched on in Part 5. So PaymentProcessing and ShipmentProcessing don’t publish directly to Kafka. Instead, they write a row to a PostgreSQL outbox table, which Npgsql already instruments. Wolverine abstracts it through its IMartenOutbox, which is injected in MartenRepository for any service that publishes messages:
The integration between Marten and Wolverine is set in MartenConfigExtension.cs with a few lines:
1
2
3
var martenConfiguration = services.AddMarten(options => ..)

martenConfiguration.IntegrateWithWolverine();
It puts Wolverine’s inbox, outbox and dead-letter tables in the same database, so outgoing messages are committed in the same transaction as Marten’s events. It also supplies the IMartenOutbox and persists the OrderSaga state as a Marten document.
The same guarantee applies to the in-process hops. Inside OrderProcessing, the domain events that move the saga forward (OrderPlaced, OrderPaid, and so on) are handed to AppendEventsAndCommitAsync along with the order, and the service runs on durable local queues:
1
2
// OrderProcessing/Program.cs
options.Policies.UseDurableLocalQueues();
So the order’s new state and the message that triggers the next saga step are committed together. A crash between the two can’t leave an order stranded halfway, and the envelope carries the trace context like any other.
How the trace survives the Kafka hop
Once the commit succeeds, Wolverine sends the staged messages to Kafka (its durability agent picks up any that were left behind) and propagates the trace context on its own. The project only declares each end:
1
2
3
4
5
6
// PaymentProcessing/Program.cs (producing side)
options.PublishMessage<PaymentFinalized>()
    .ToKafkaTopic("payments").UseDurableOutbox();

// OrderProcessing/Program.cs (consuming side)
options.ListenToKafkaTopic("payments").UseDurableInbox();
Following a single order.id across that hop looks like this:
The producing side (e.g.
PaymentProcessing, already inside the trace that arrived over HTTP) stagesPaymentFinalizedin its outbox, and Wolverine stores the active span’s W3C id (trace id and span id) on the outgoing envelope. The row only lives for milliseconds here. The Kafka failure scenario below catches it sitting inwolverine_outgoing_envelopes.After the commit, the message is sent to the
payments(orshipments) topic, carrying that id in Wolverine’s ownparent-idheader.On the consuming side, Wolverine reads
parent-idback and opens the handler span (e.g.OrderSagahandlingPaymentFinalized) as its child, so it keeps the sameTraceId.
So the order runs under one trace from the PlaceOrder request until the shipment is recorded.
Causing and spotting technical failures
The two failure cases below are technical, and both are investigated from the order’s Telemetry link.
Kafka is down: the outbox holds the event
1 - Stop the broker, then place an order from the SPA:
1
docker compose stop kafka
SPA: order 5134E496
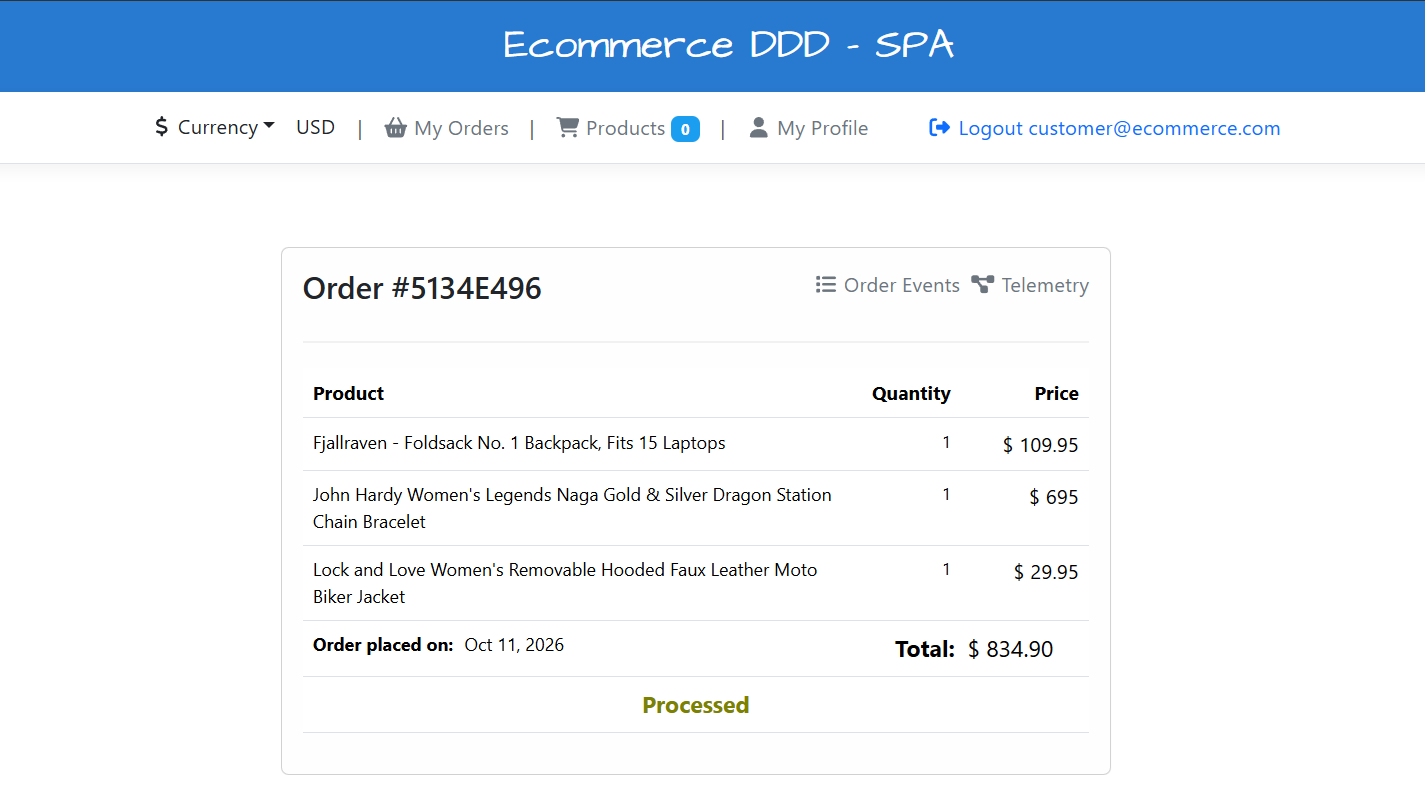
The payment is committed, but PaymentFinalized can’t leave the outbox, so the order stays Processed.
Structured logs: filtered by order.id, without HttpClient
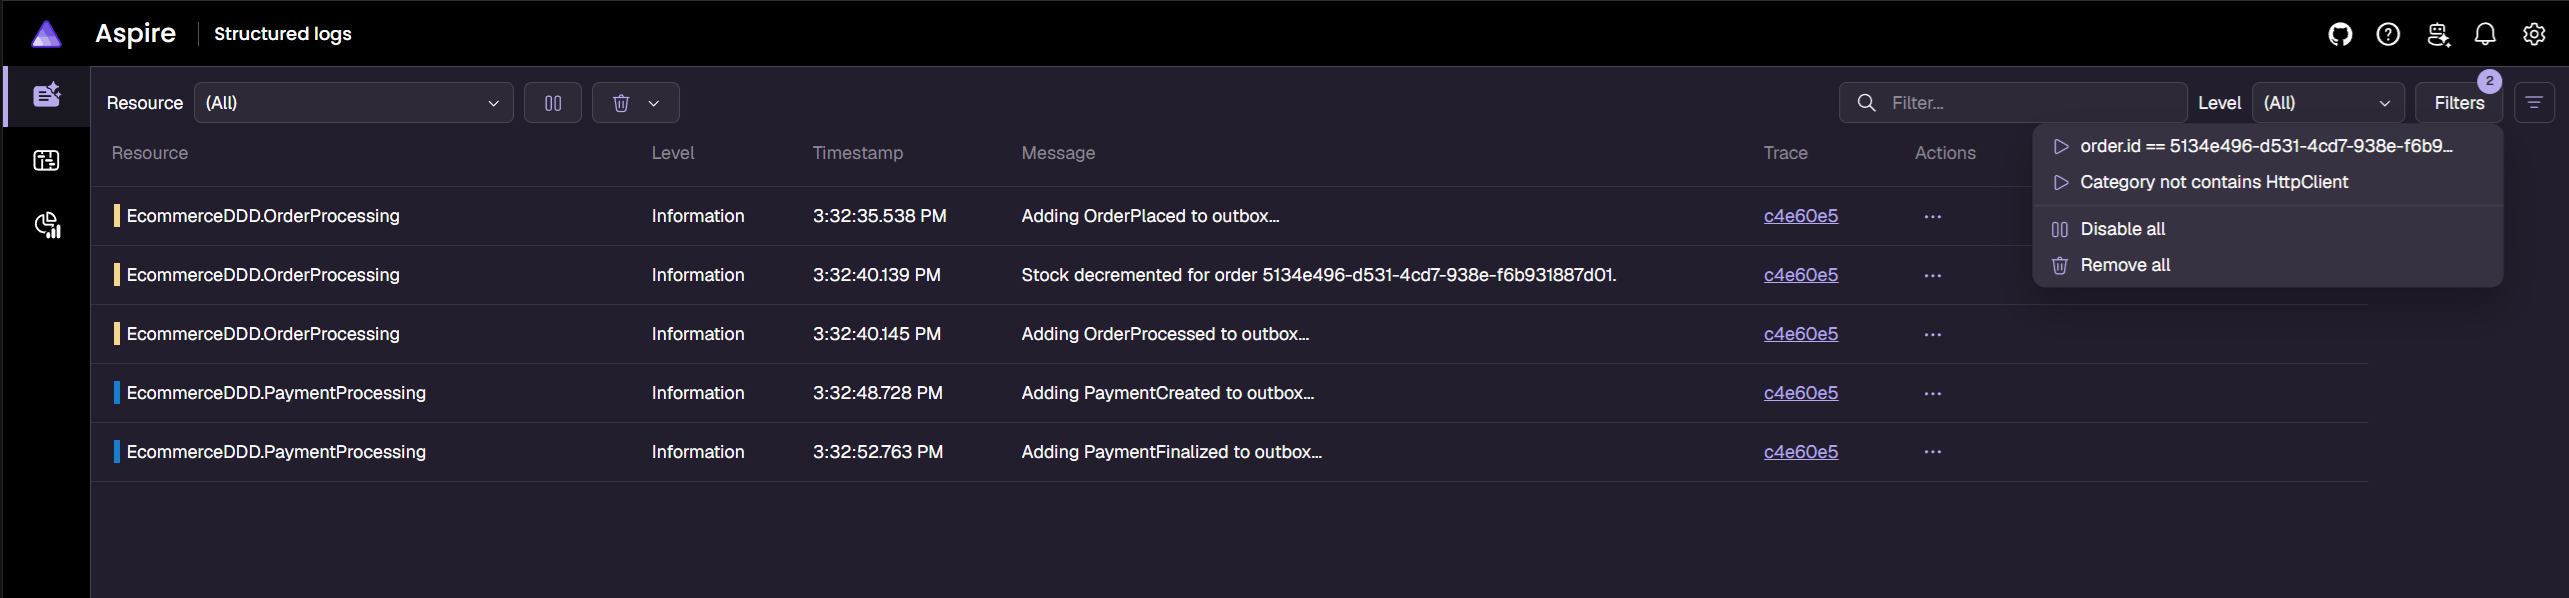
The order’s telemetry just stops at Adding PaymentFinalized to outbox..., with no error. The cause is in PaymentProcessing’s errors:
Structured logs: filtered by PaymentProcessing, level Error
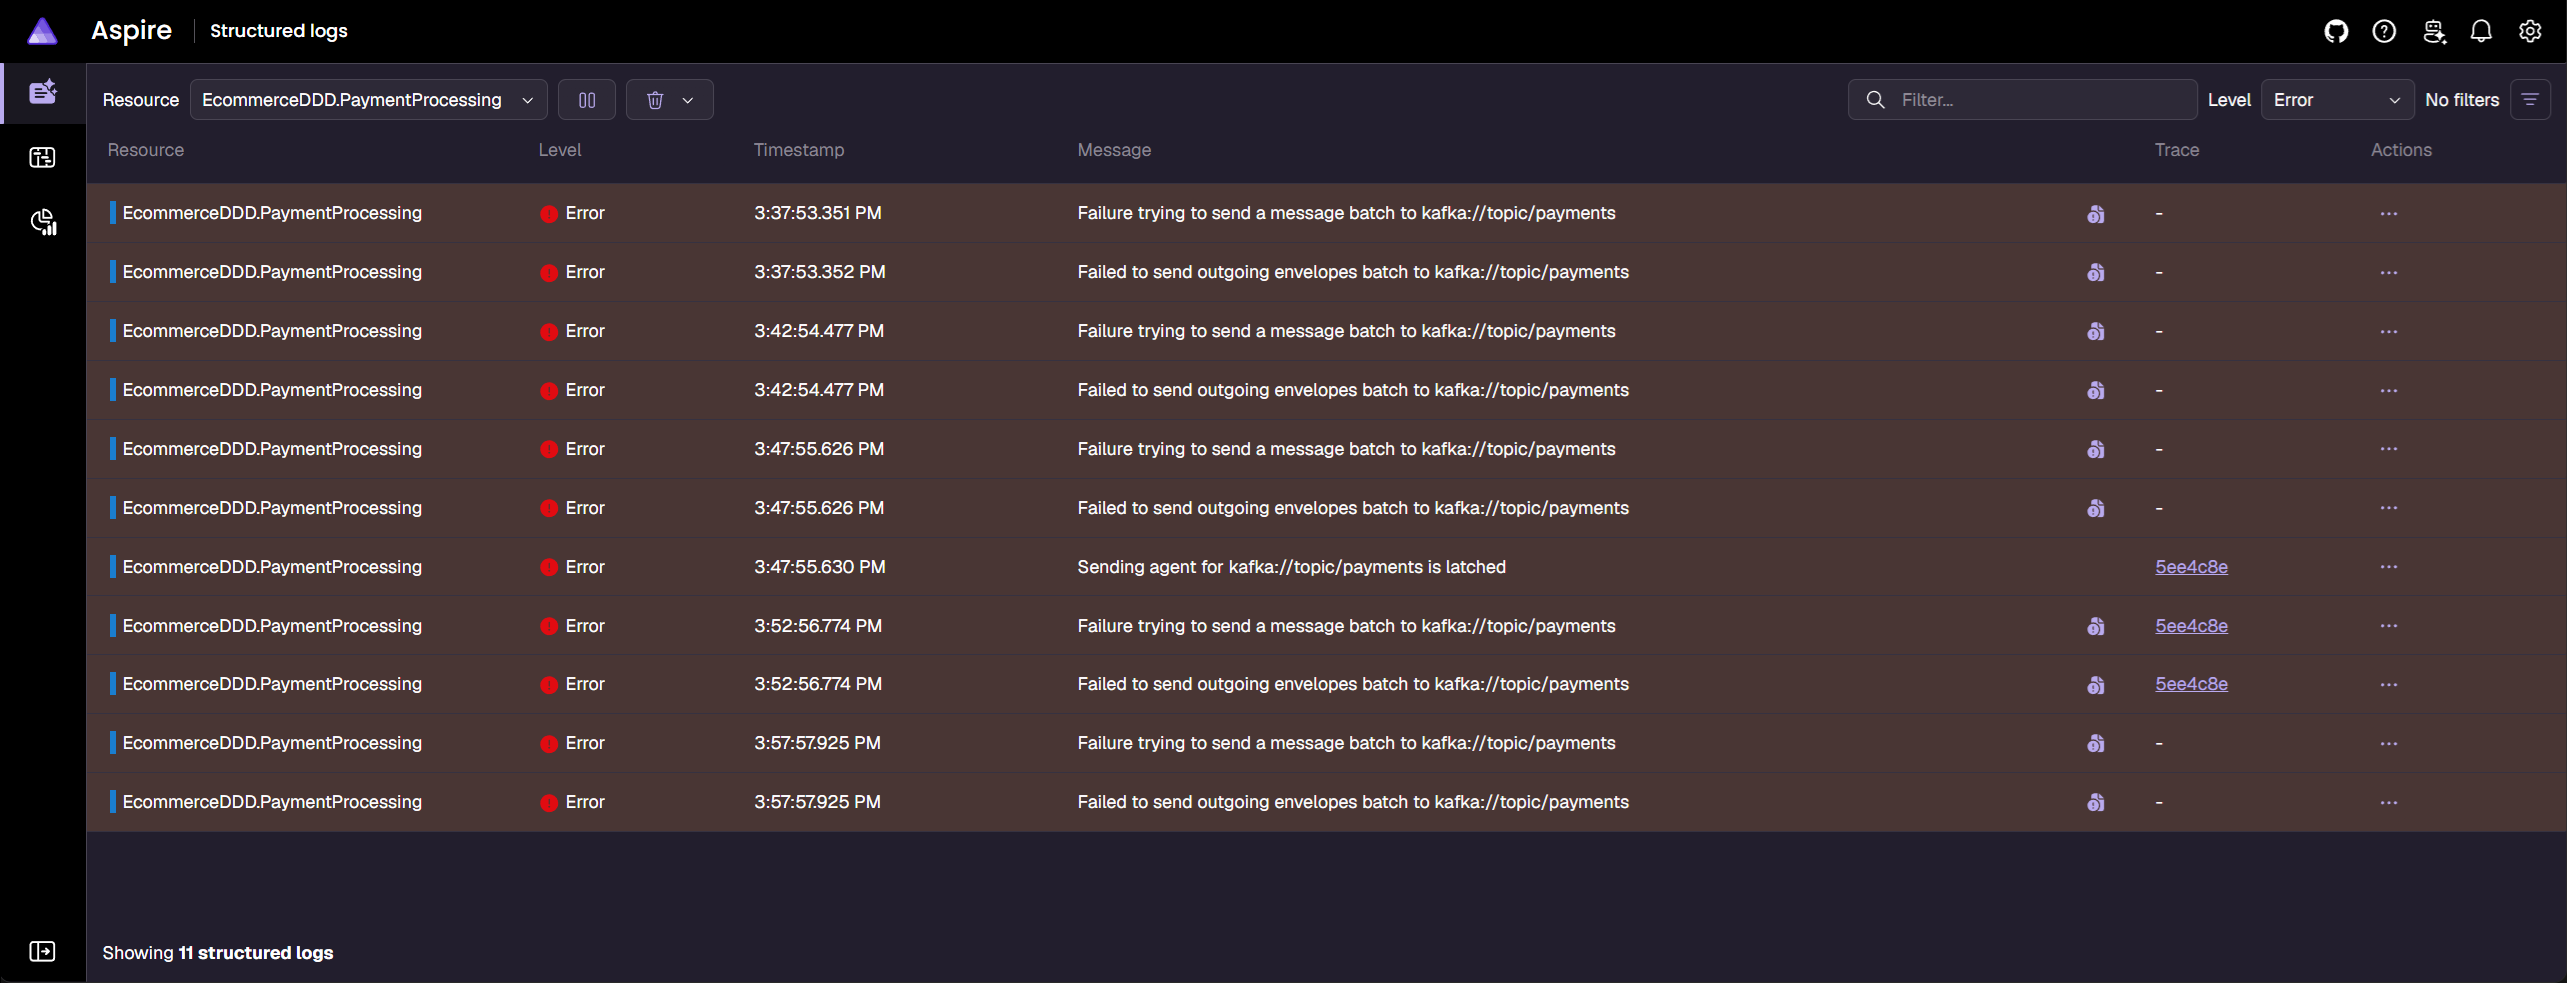
The sending agent can’t reach kafka://topic/payments. These errors have no order.id, because the sending agent works per destination, outside any order’s trace.
The envelope is still in the outbox:
1
docker exec postgresql psql -U postgres -d paymentsdb -c "select id, destination, attempts, message_type from payments_read.wolverine_outgoing_envelopes"
1
2
3
4
                  id                  |      destination       | attempts |   message_type
--------------------------------------+------------------------+----------+------------------
 08df27ce-714e-d73f-8aae-f7b27fd20000 | kafka://topic/payments |        0 | PaymentFinalized
(1 row)
2 - Then, bring the broker back:
1
docker compose start kafka
Wolverine sends the staged message, and OrderProcessing picks the flow up where it stopped:
Structured logs: filtered by order.id, without HttpClient
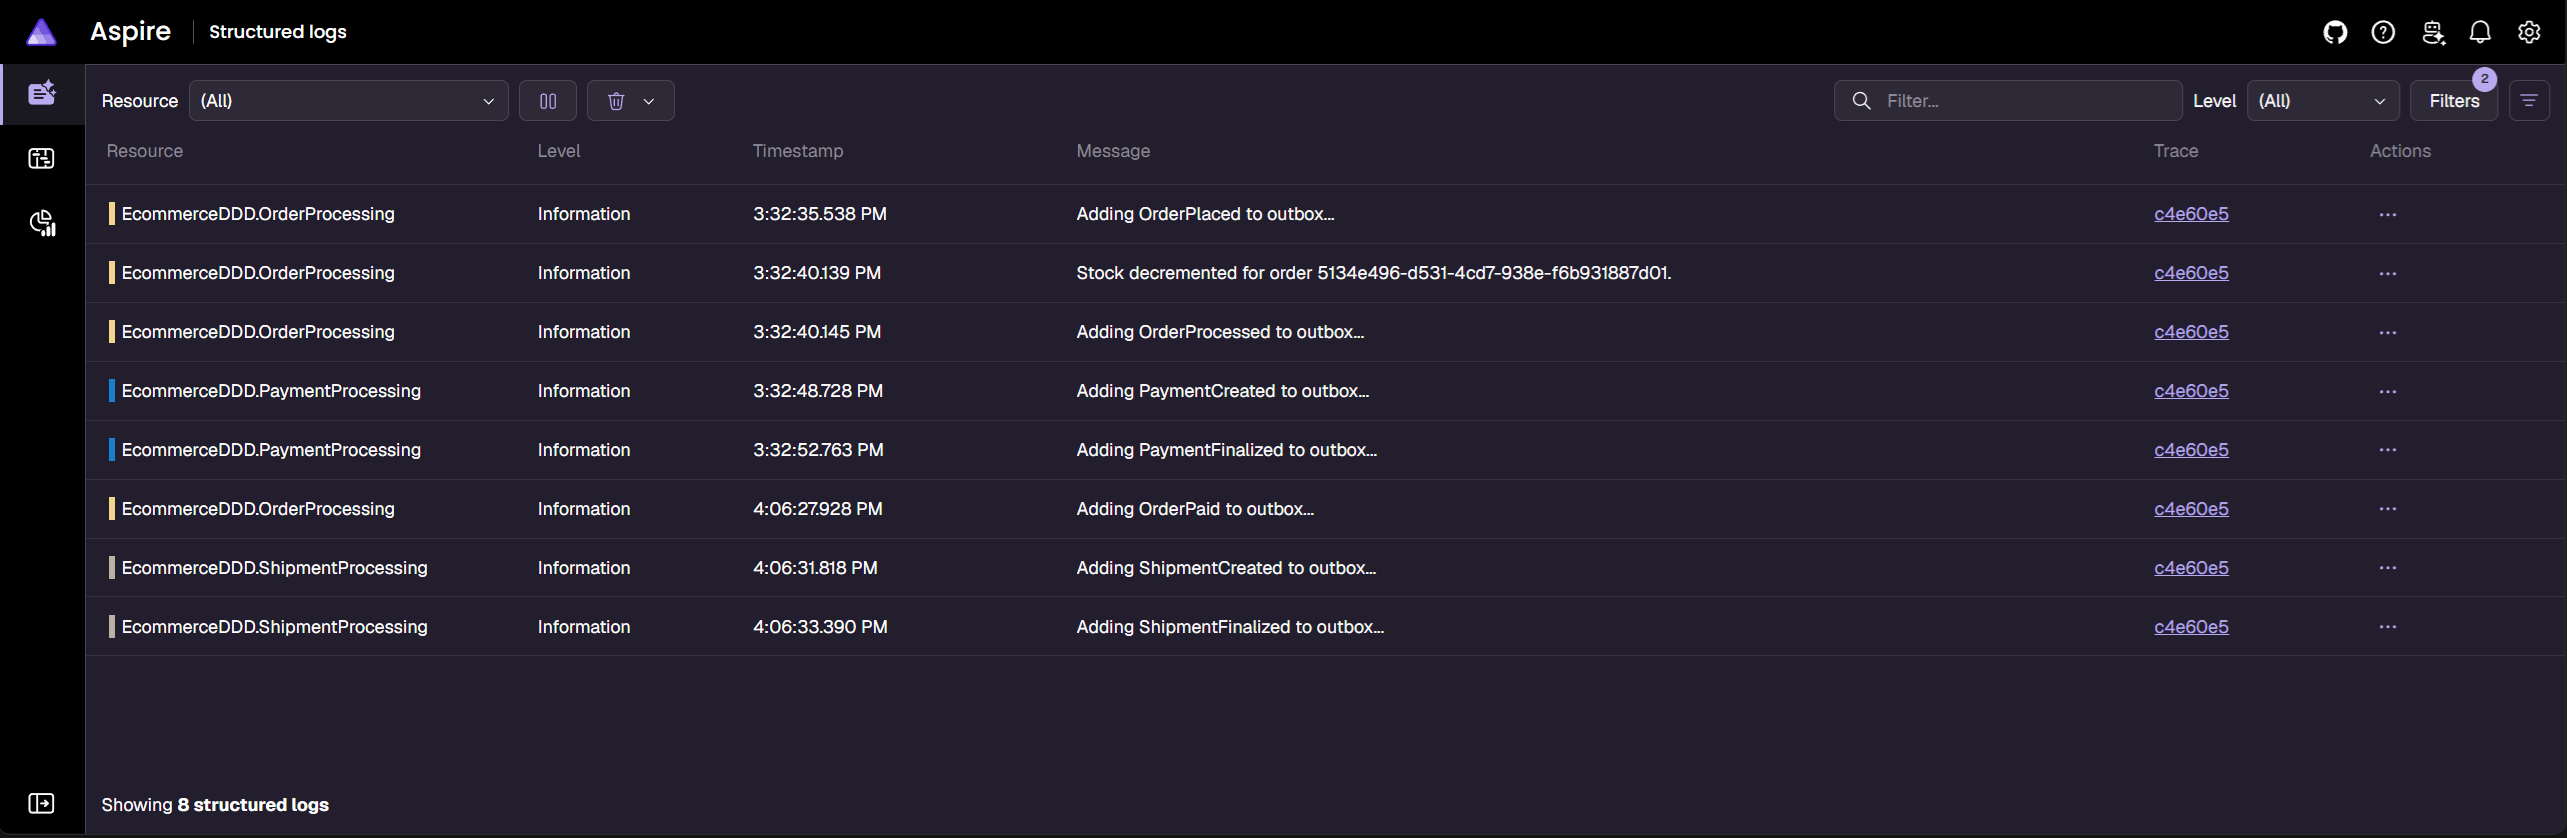
The same filter shows the flow resuming at OrderPaid later, under the same TraceId. The envelope kept its parent-id in the outbox, so the outage shows up as a gap, not as a broken trace.
A downstream service is down: retry, then dead-letter
1 - Stop ShipmentProcessing, then place an order:
1
docker compose stop ecommerceddd-shipment-processing
RequestShipmentHandler calls ShipmentProcessing over HTTP and lets the failure throw, so Wolverine’s retry policy in CoreInfrastructureExtensions takes over:
1
2
3
4
5
6
7
8
options.Policies
    .OnException<HttpRequestException>()
    .Or<ConcurrencyException>()
    .Or<DocumentAlreadyExistsException>()
    .Or<ExistingStreamIdCollisionException>()
    .RetryWithCooldown(
        TimeSpan.FromMilliseconds(50), TimeSpan.FromMilliseconds(100), TimeSpan.FromMilliseconds(250))
    .Then.ScheduleRetry(RetryDelays);
A failed HTTP call is retried a few times in place, then rescheduled with growing delays. Once the attempts run out, the message goes to the dead letters. Wolverine is the only retry layer: the HTTP clients don’t retry, so the calls to a struggling service don’t multiply. A broken domain rule, or a 4xx (client error) from another service, skips the retries and goes straight to the dead letters (except 408 and 429).
SPA: order A287AA57
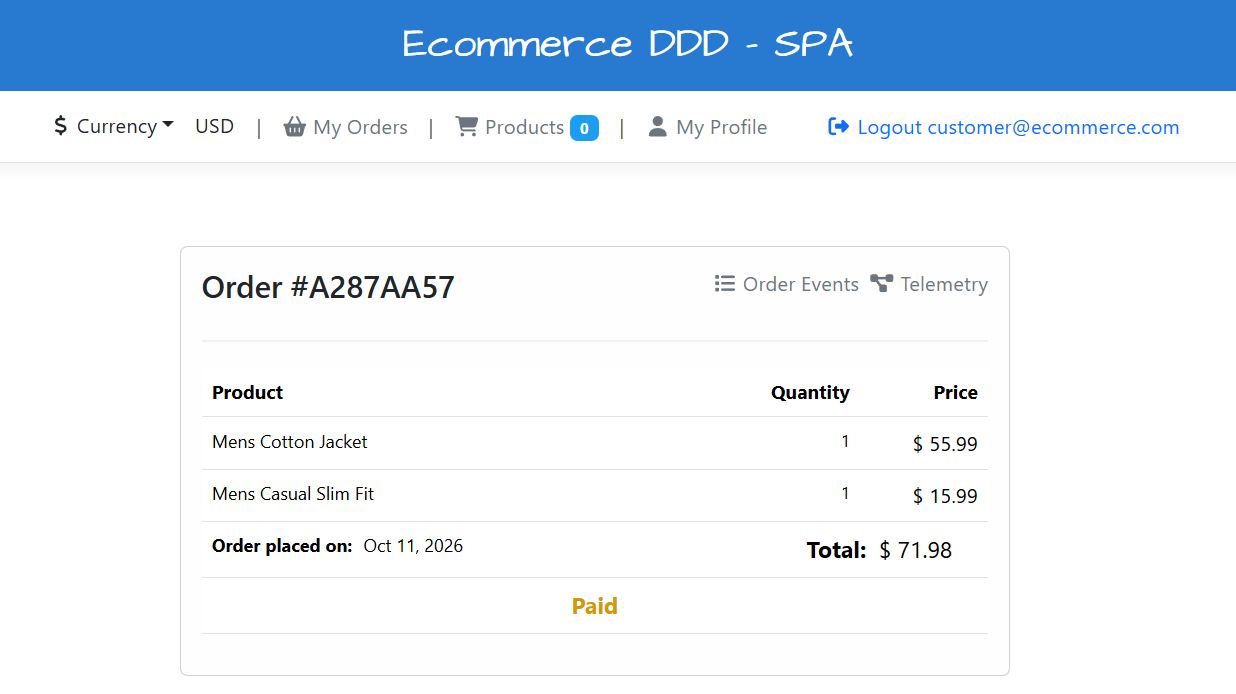
The order stays Paid. This time, the order’s telemetry shows the error:
Trace: b625e6f, filtered by RequestShipment
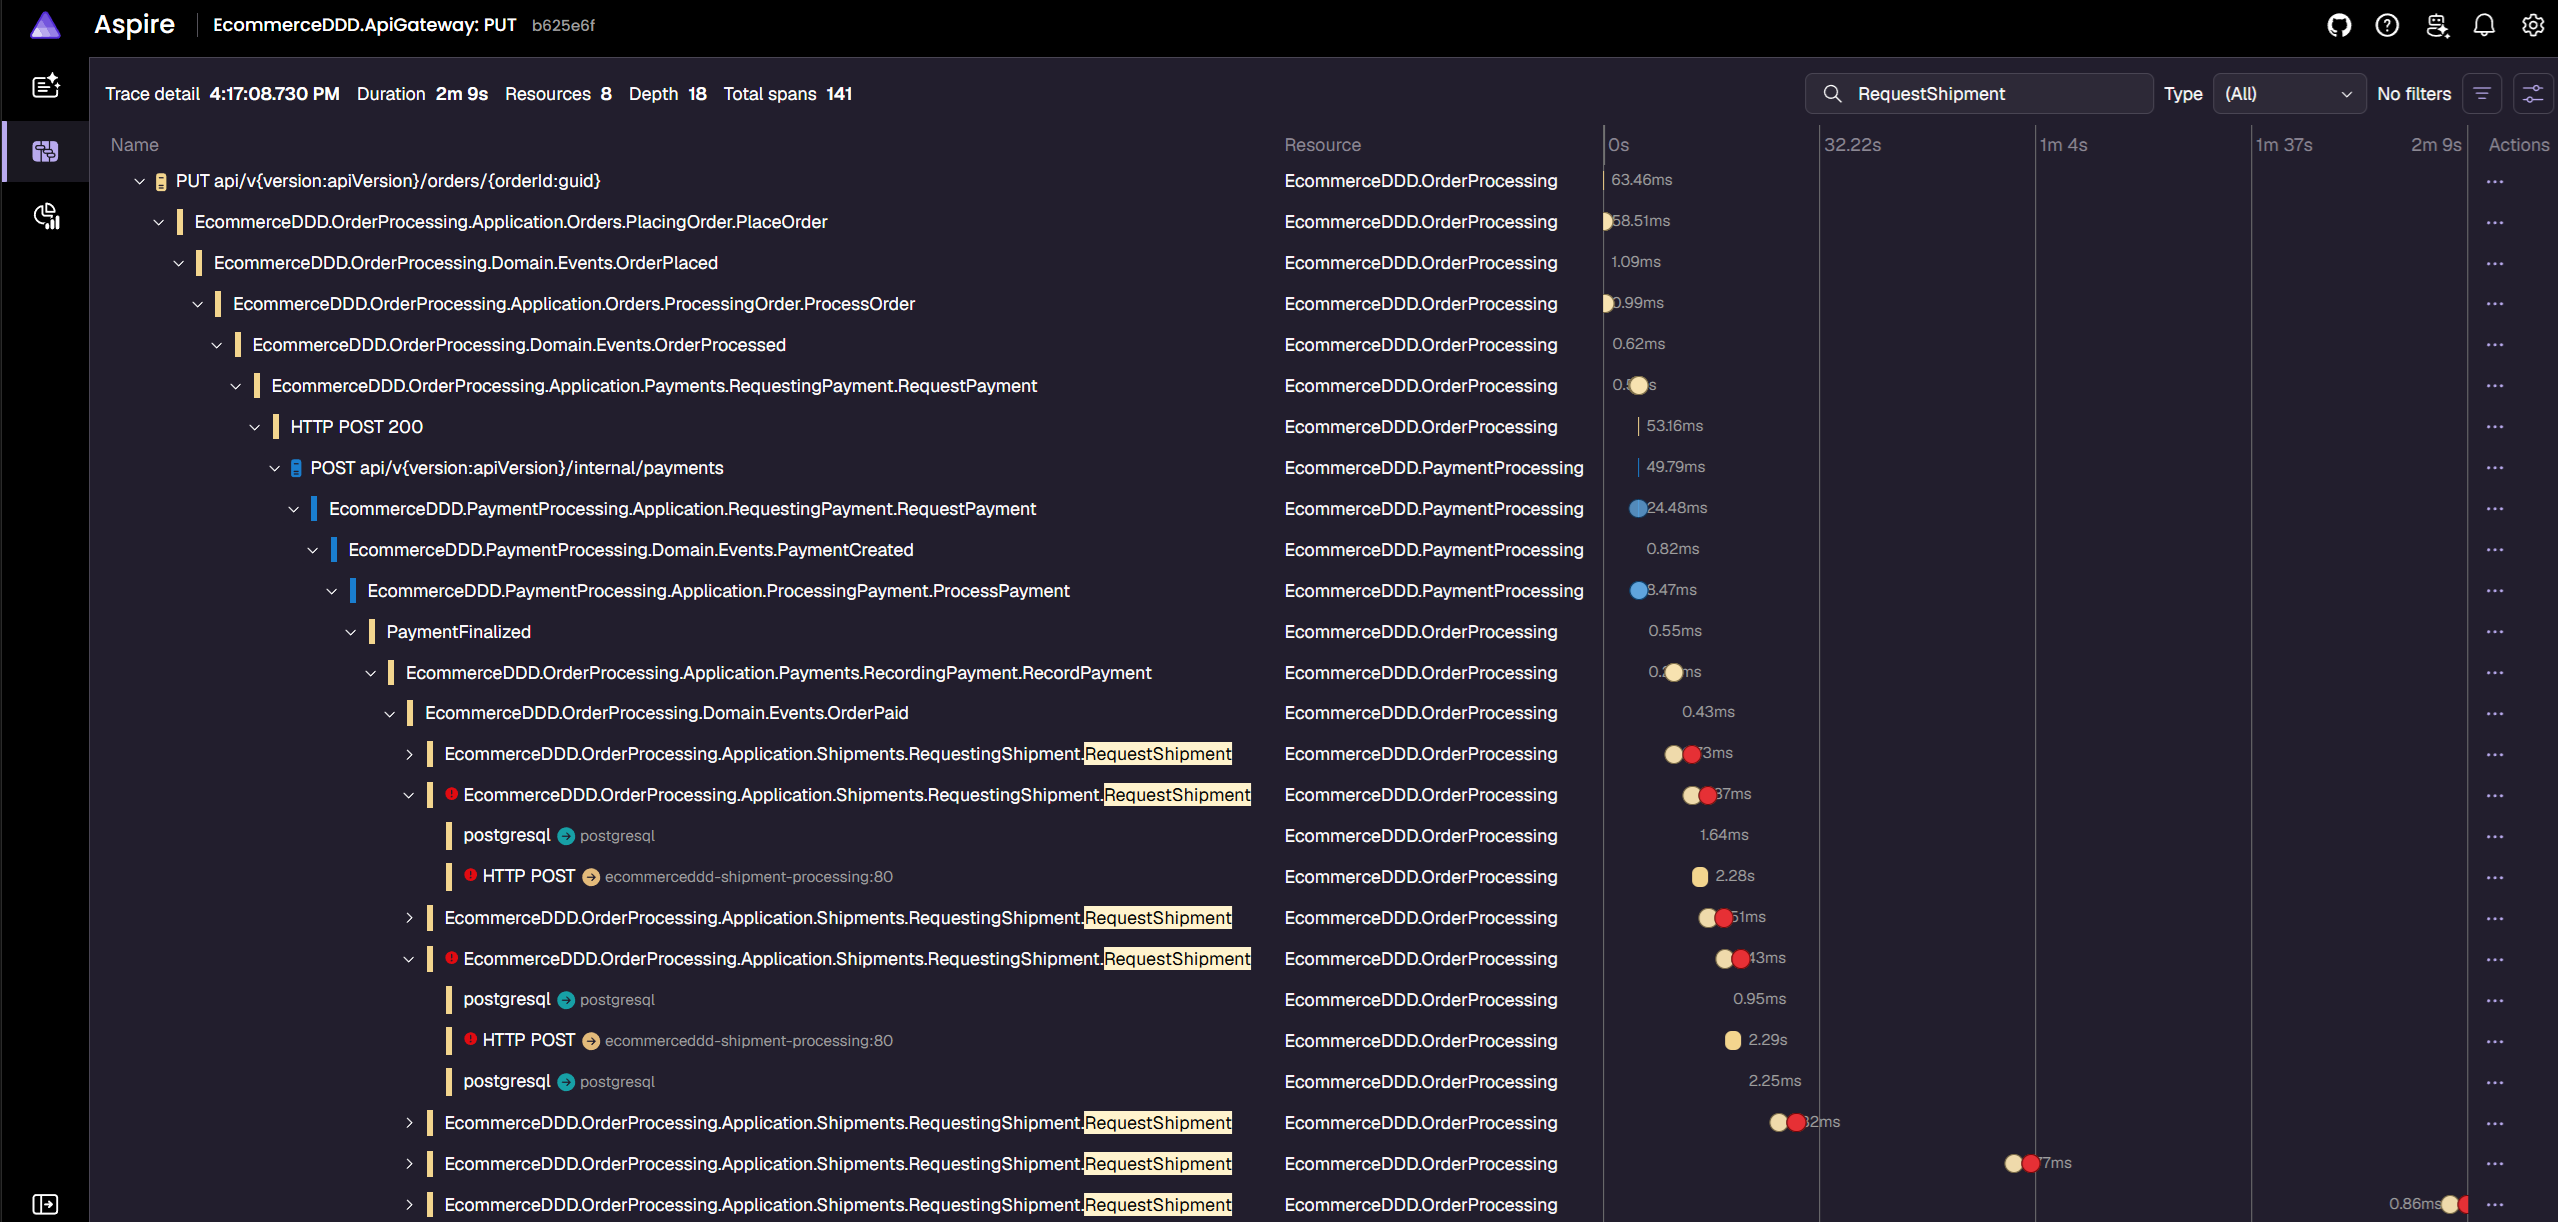
Each RequestShipment attempt fails on its HTTP POST to ShipmentProcessing, and both spans are marked as errors. Unlike the cases in Types of errors from Part 1, there’s no server span this time, since no server answered.
Structured logs: filtered by order.id, without HttpClient
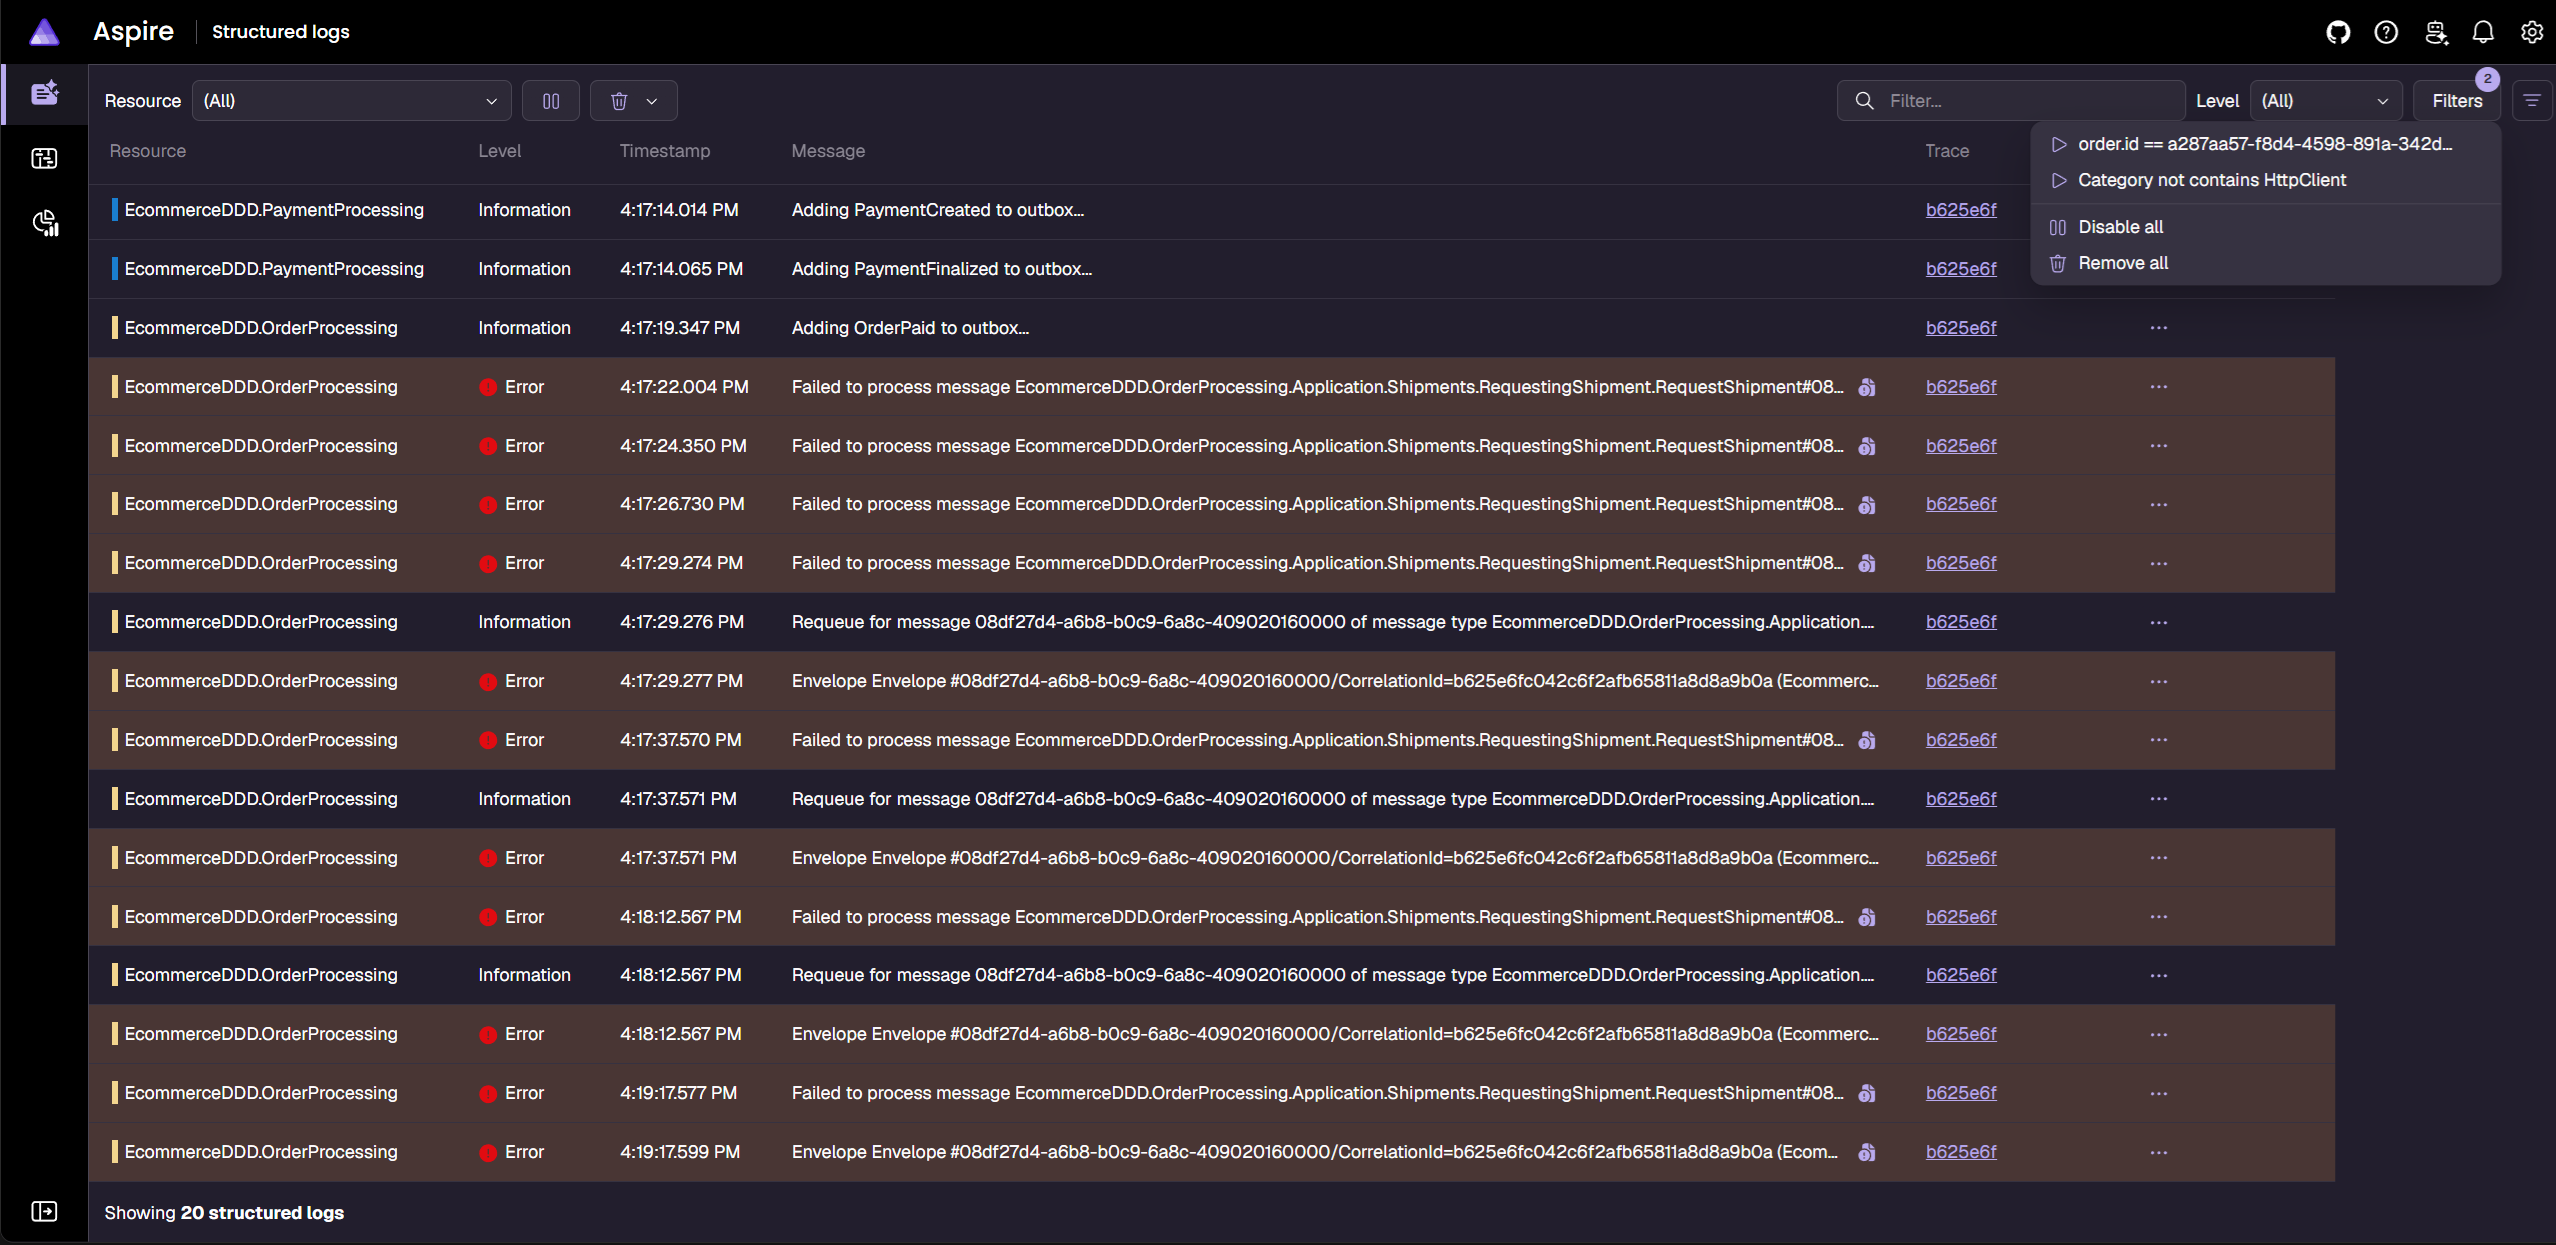
Unlike the Kafka outage, the same order.id filter shows that each attempt fails and is retried, until the last one dead-letters:
1
docker exec postgresql psql -U postgres -d ordersdb -c "select id, message_type, exception_message, replayable from orders_read.wolverine_dead_letters"
1
2
3
4
                  id                  |                                      message_type                                     |                        exception_message                        | replayable
--------------------------------------+---------------------------------------------------------------------------------------+-----------------------------------------------------------------+------------
 08df27d4-a6b8-b0c9-6a8c-409020160000 | EcommerceDDD.OrderProcessing.Application.Shipments.RequestingShipment.RequestShipment | Name or service not known (ecommerceddd-shipment-processing:80) | f
(1 row)
2 - Bring the service back:
1
docker compose start ecommerceddd-shipment-processing
3 - Then, replay the dead letter. OrderProcessing exposes Wolverine’s dead-letter endpoints, but a replay only flags the row as replayable for the durability agent to pick up, so a direct update does the same:
1
docker exec postgresql psql -U postgres -d ordersdb -c "update orders_read.wolverine_dead_letters set replayable = true where id = '08df27d4-a6b8-b0c9-6a8c-409020160000'"
1
UPDATE 1
Trace: b625e6f, filtered by Shipment
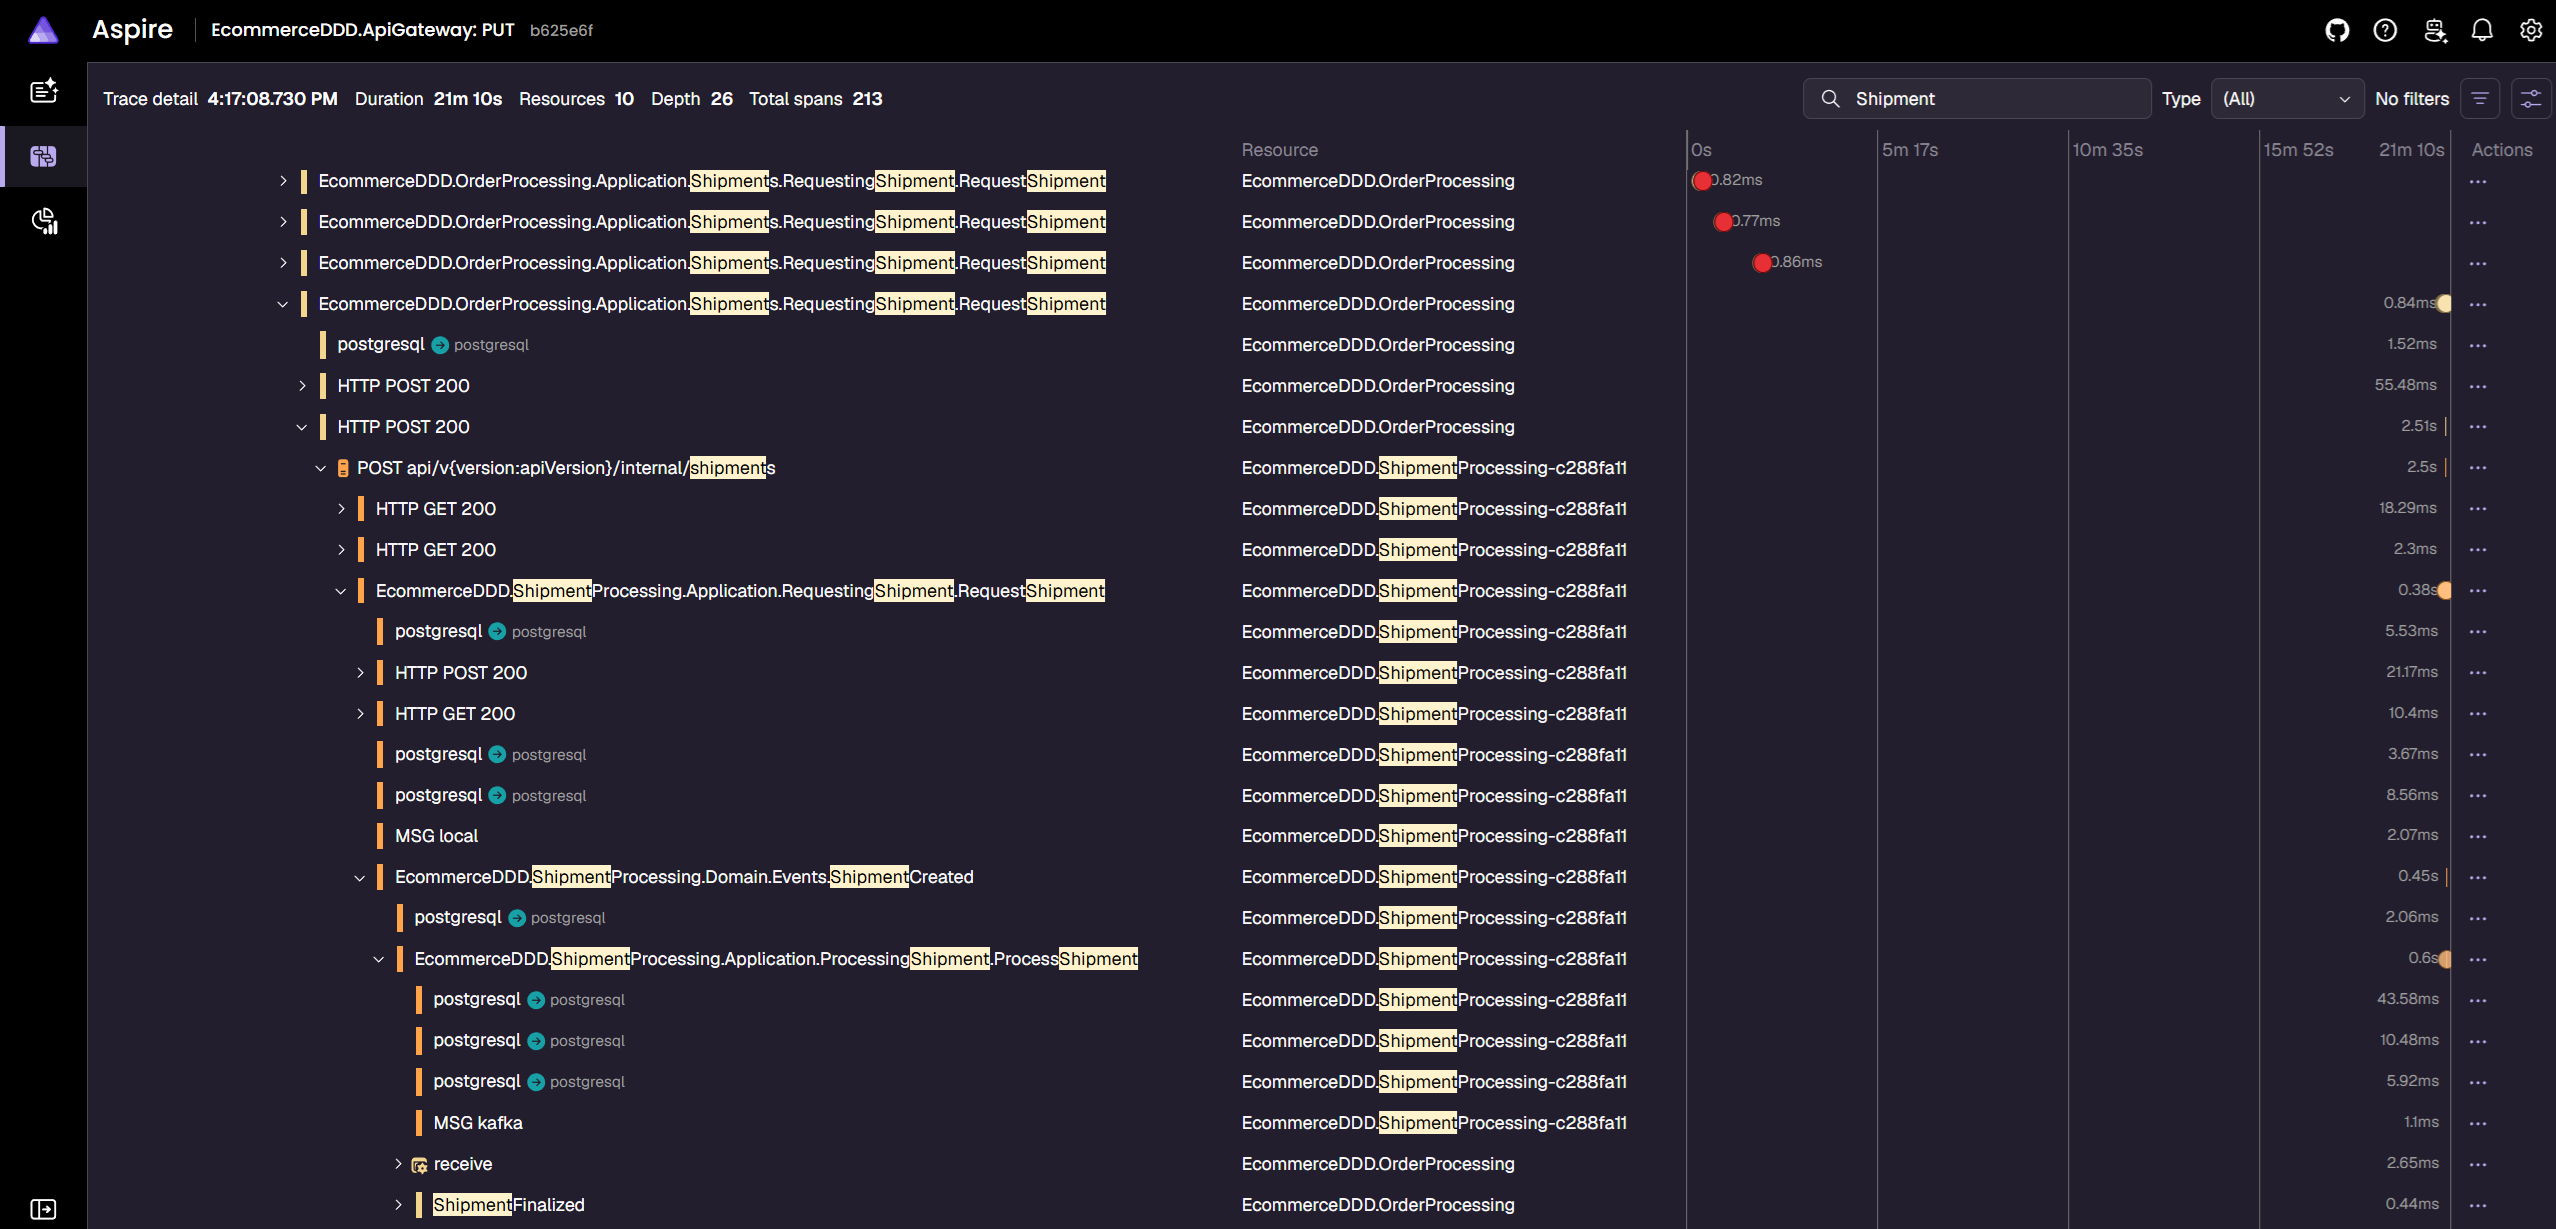
The collapsed RequestShipment spans are the last failed attempts, and the expanded one is the replay. The dead-lettered envelope kept its parent-id, so the recovery runs in the same trace through to ShipmentFinalized, resuming the flow.
Metrics
While traces and logs tell the story of one order, a metric tells how the system behaves over time.
Counting failures
Wolverine exports its own meter, which counts messages, and each failure from the scenarios above lands in a different metric:
| Failure | Service | Metric |
|---|---|---|
Kafka down: PaymentFinalized waits in the outbox | PaymentProcessing | wolverine-outbox-count |
Each failed RequestShipment attempt | OrderProcessing | wolverine-execution-failure |
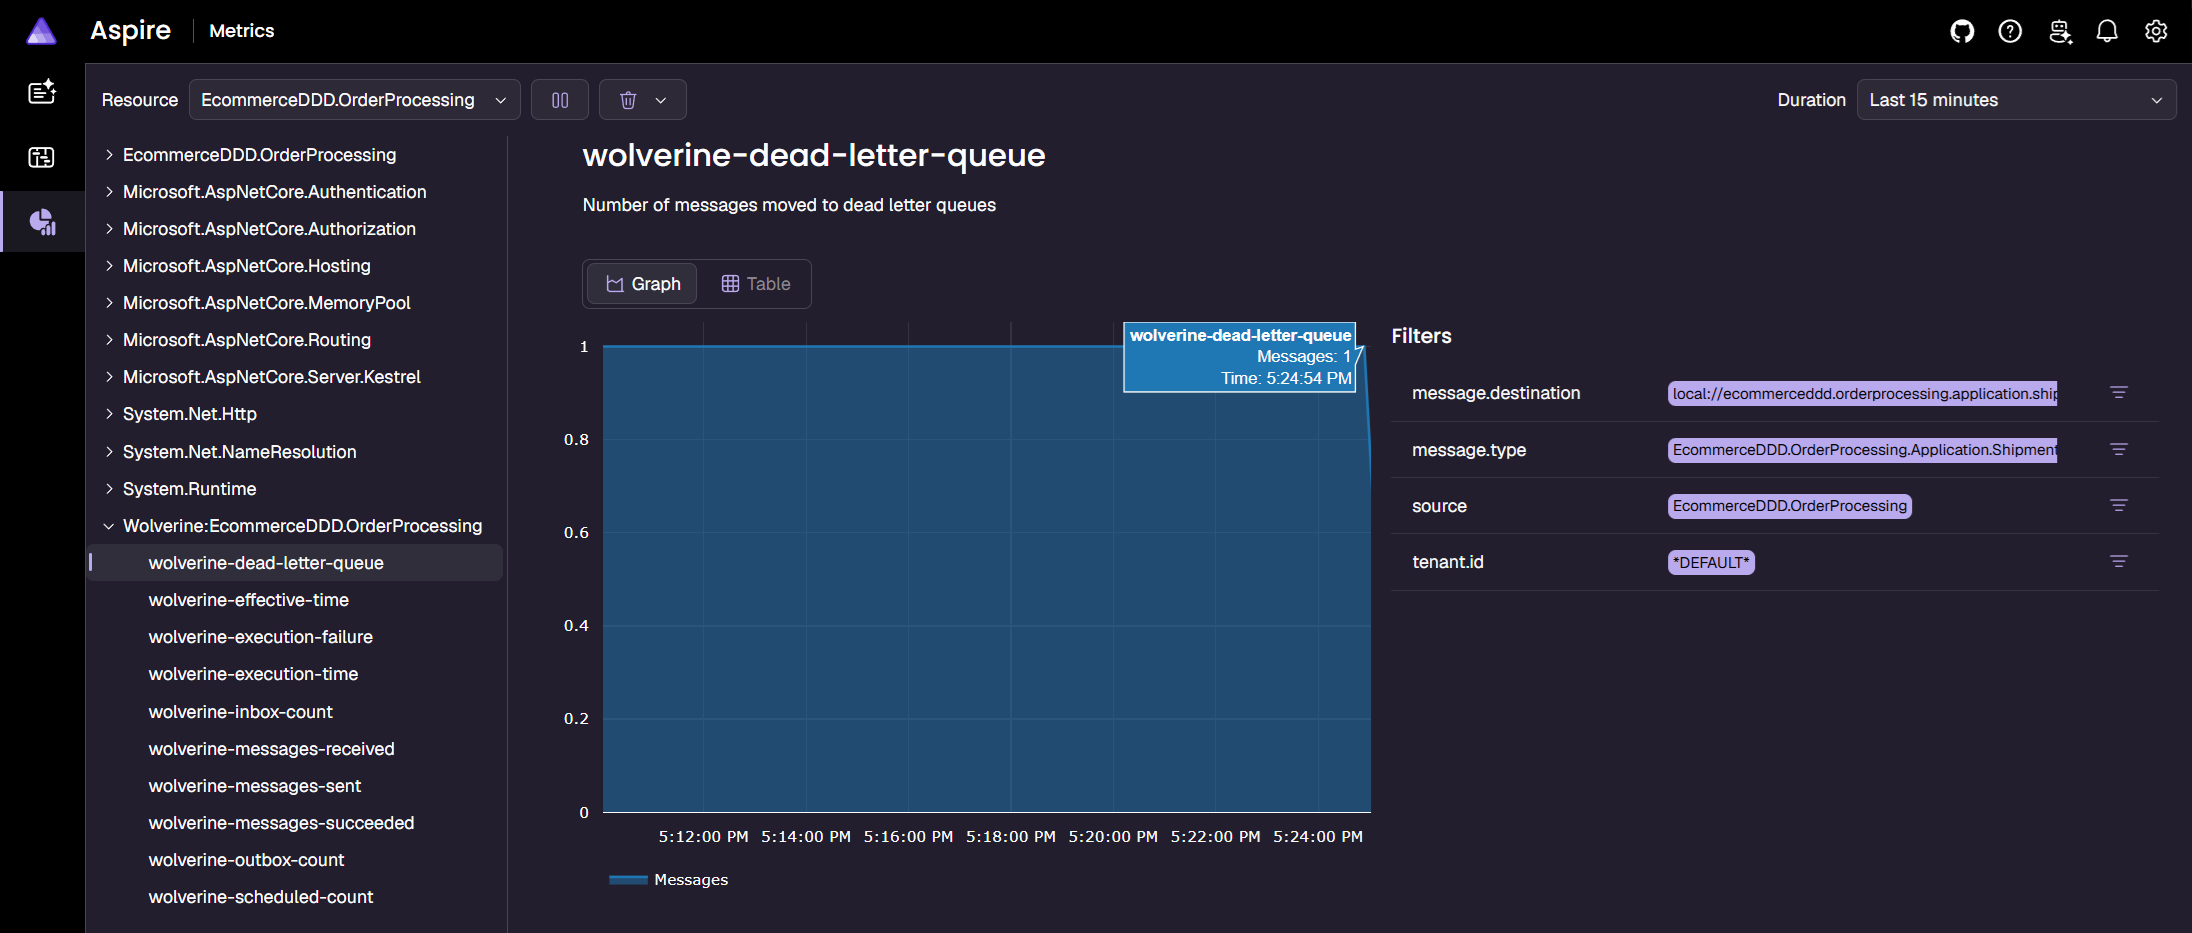
RequestShipment runs out of retries | OrderProcessing | wolverine-dead-letter-queue |
Metric: wolverine-dead-letter-queue
Counting orders
OrderMetrics adds a business metric for the orders that reach a terminal state, tagged by outcome and, for cancellations, by reason:
The meter is named after the service, which is the meter AddOpenTelemetryObservability already exports.
ConfirmDeliveryHandler records a completed order, after it’s committed:
1
_orderMetrics.RecordCompleted();
CancelOrderHandler records a canceled one after it’s committed, with its reason (out_of_stock, credit_limit, not_delivered, quote_unavailable):
1
_orderMetrics.RecordCanceled(command.CancellationReason);
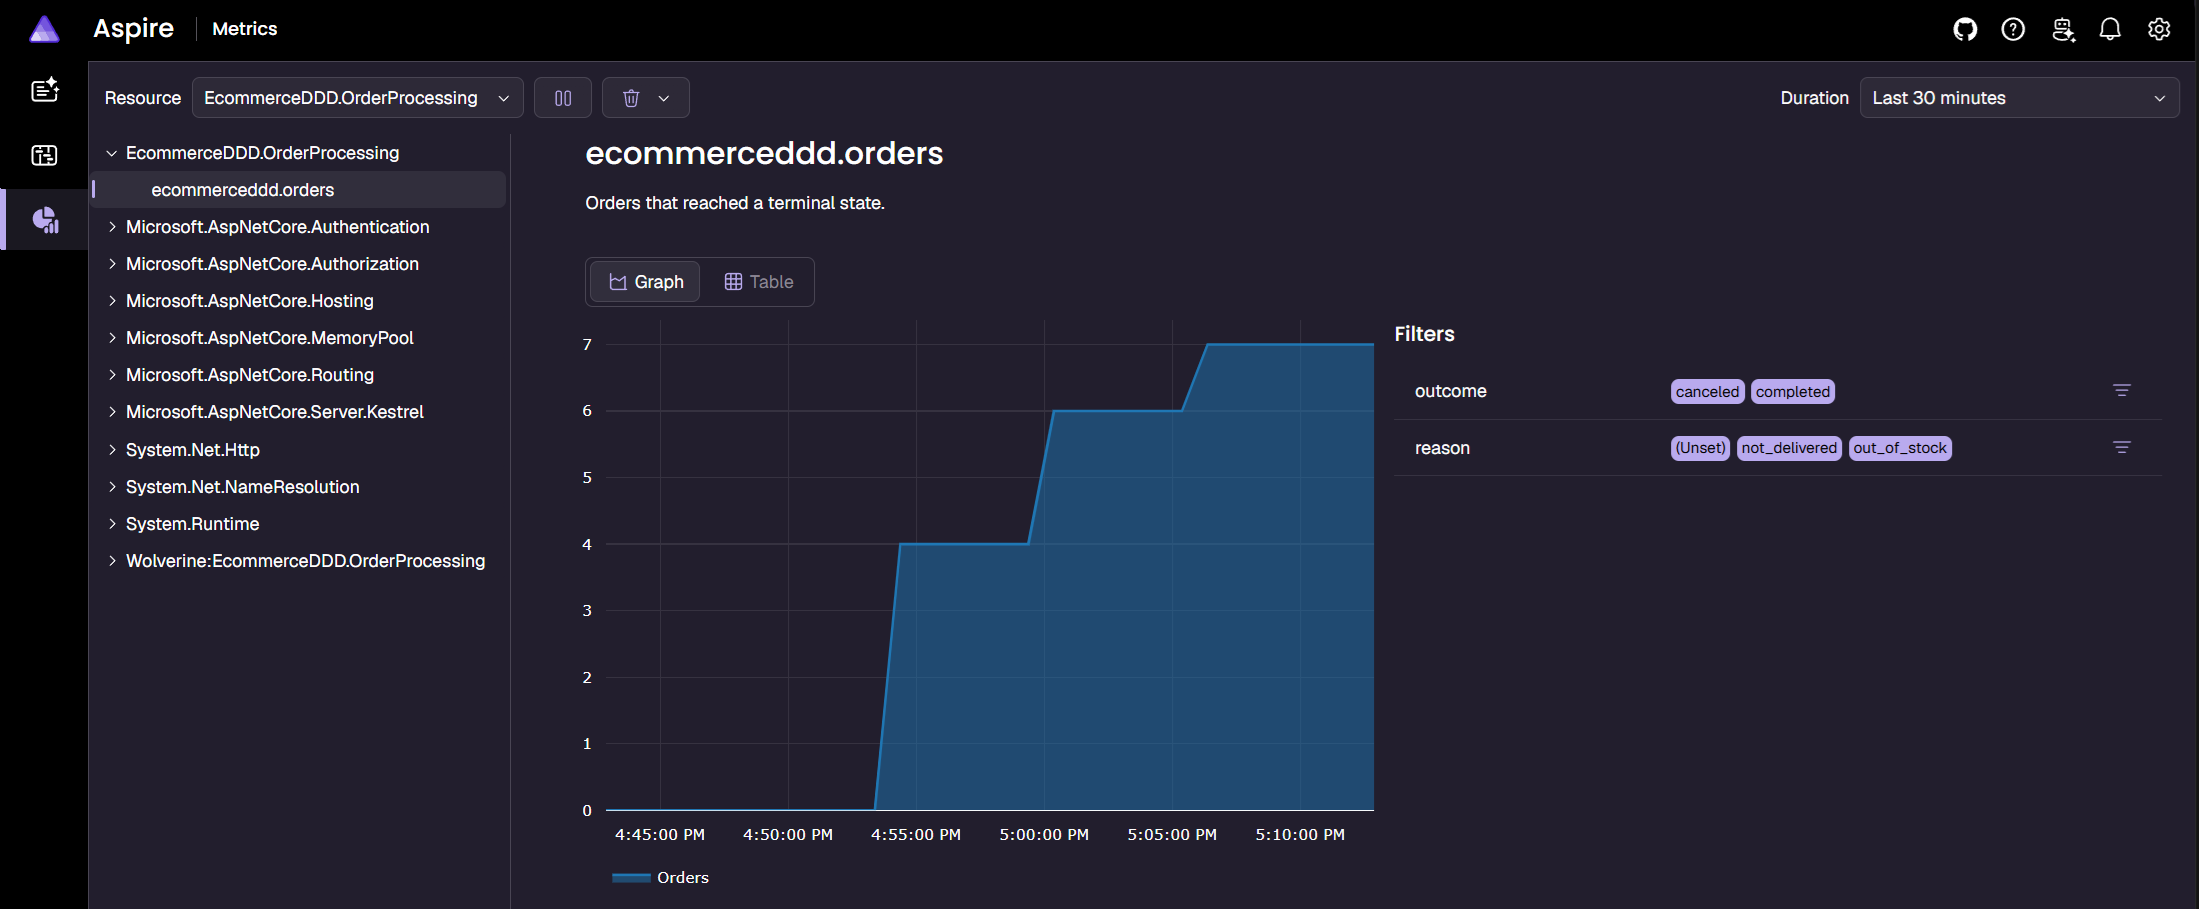
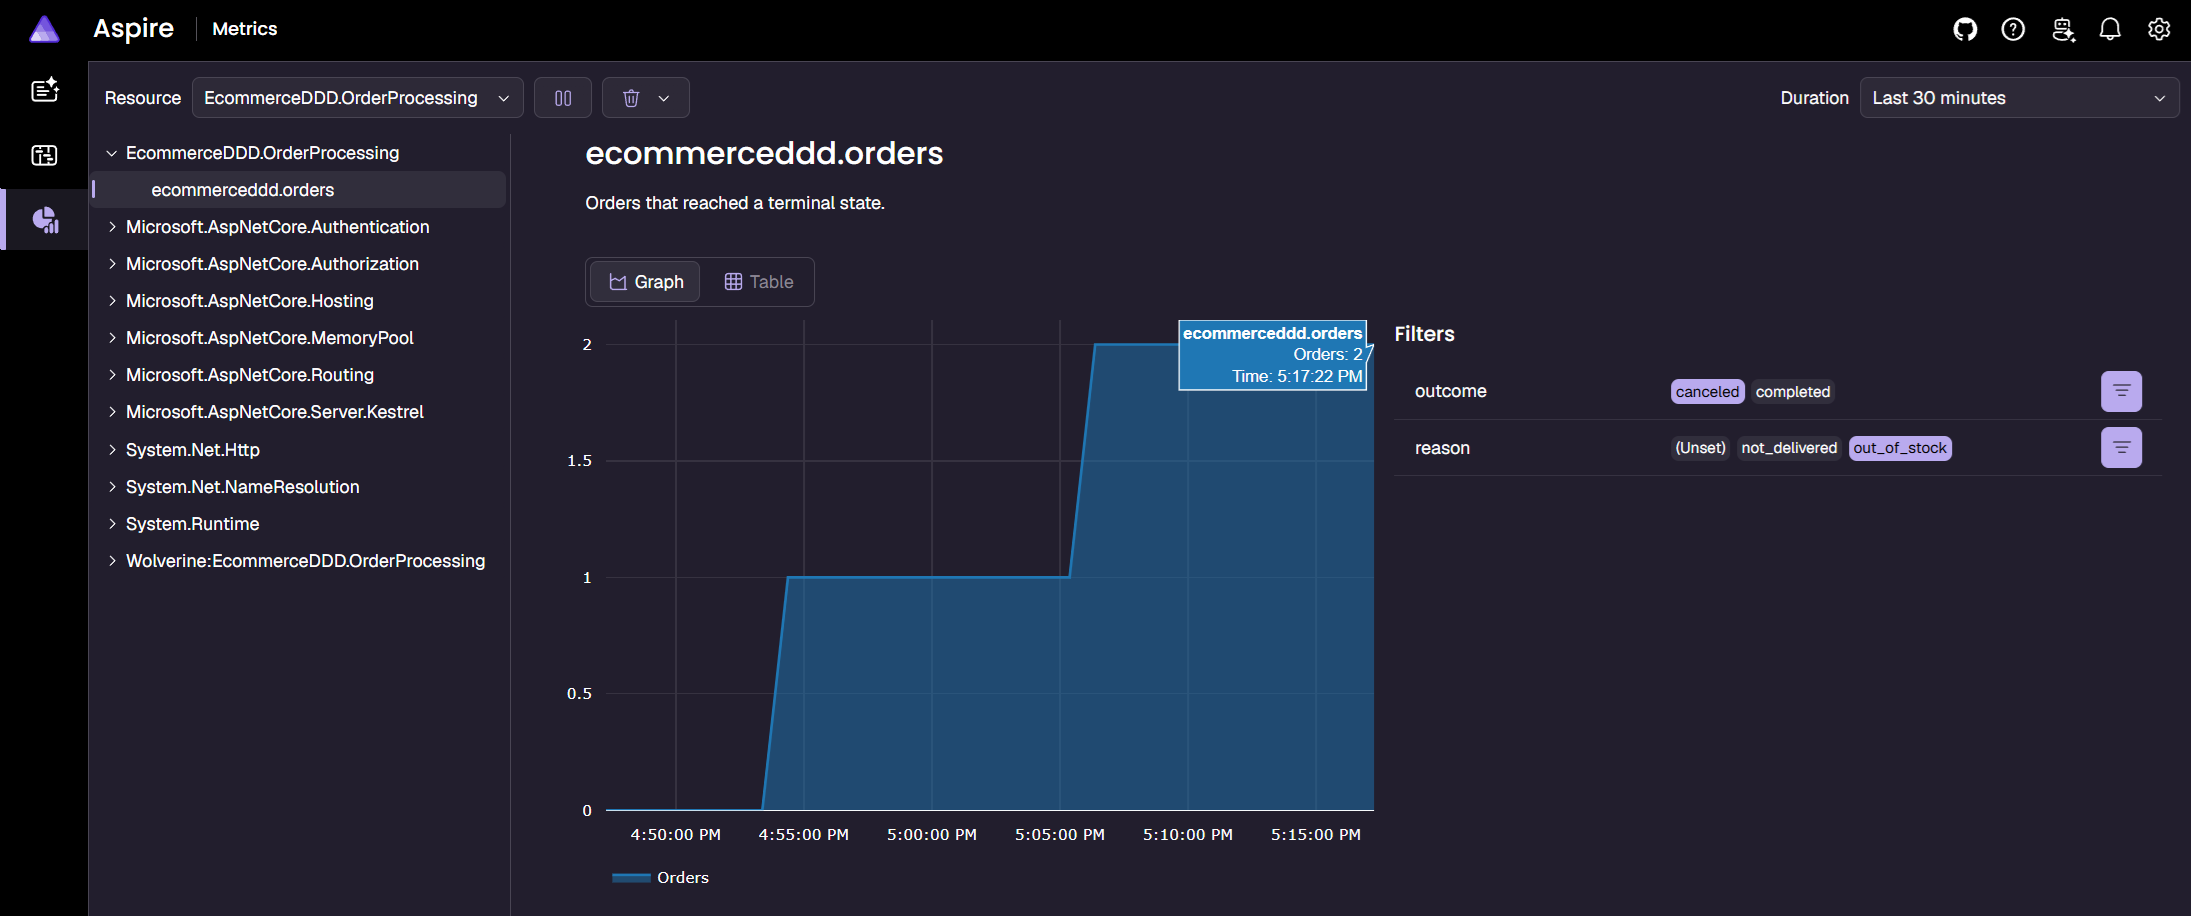
The Metrics view shows every order that reached a terminal state:
Metric: ecommerceddd.orders
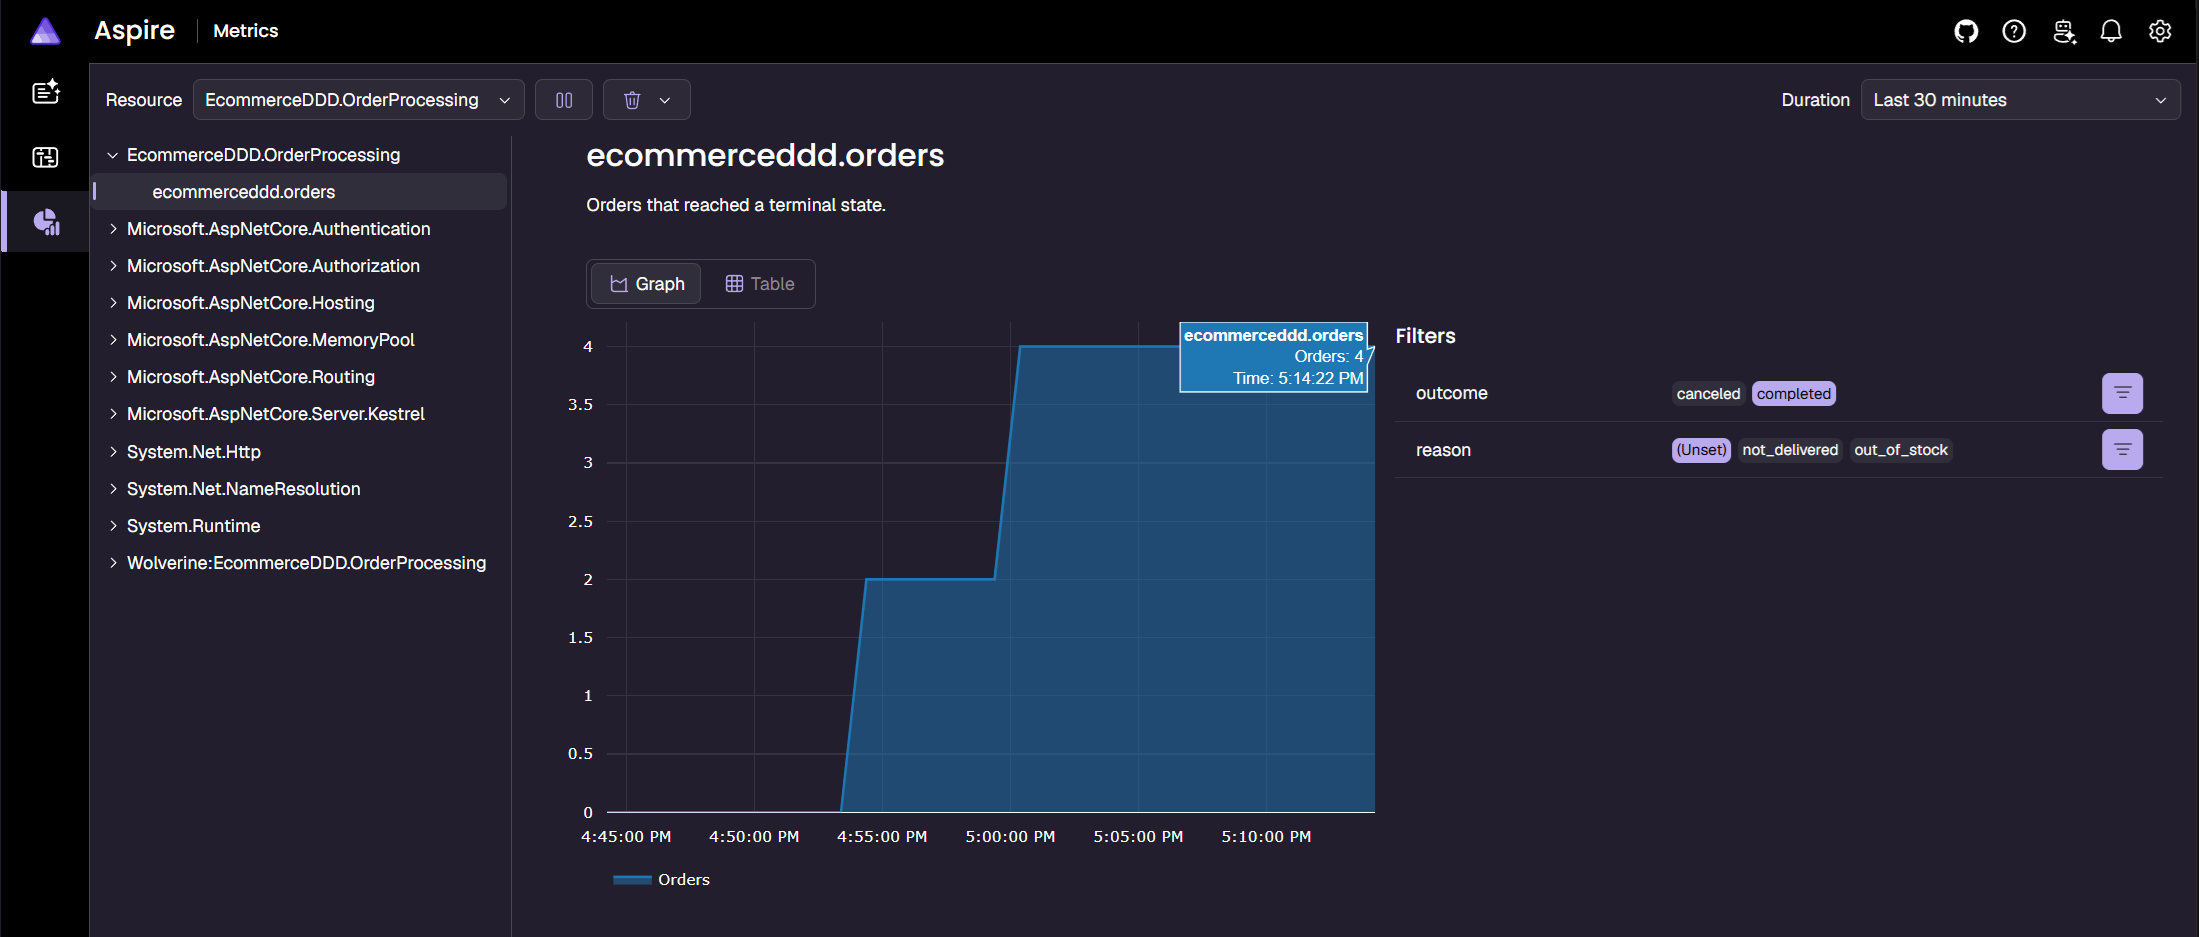
Filter by the outcome and reason tags to split that count:
outcome: completed
outcome: canceled, reason: not_delivered
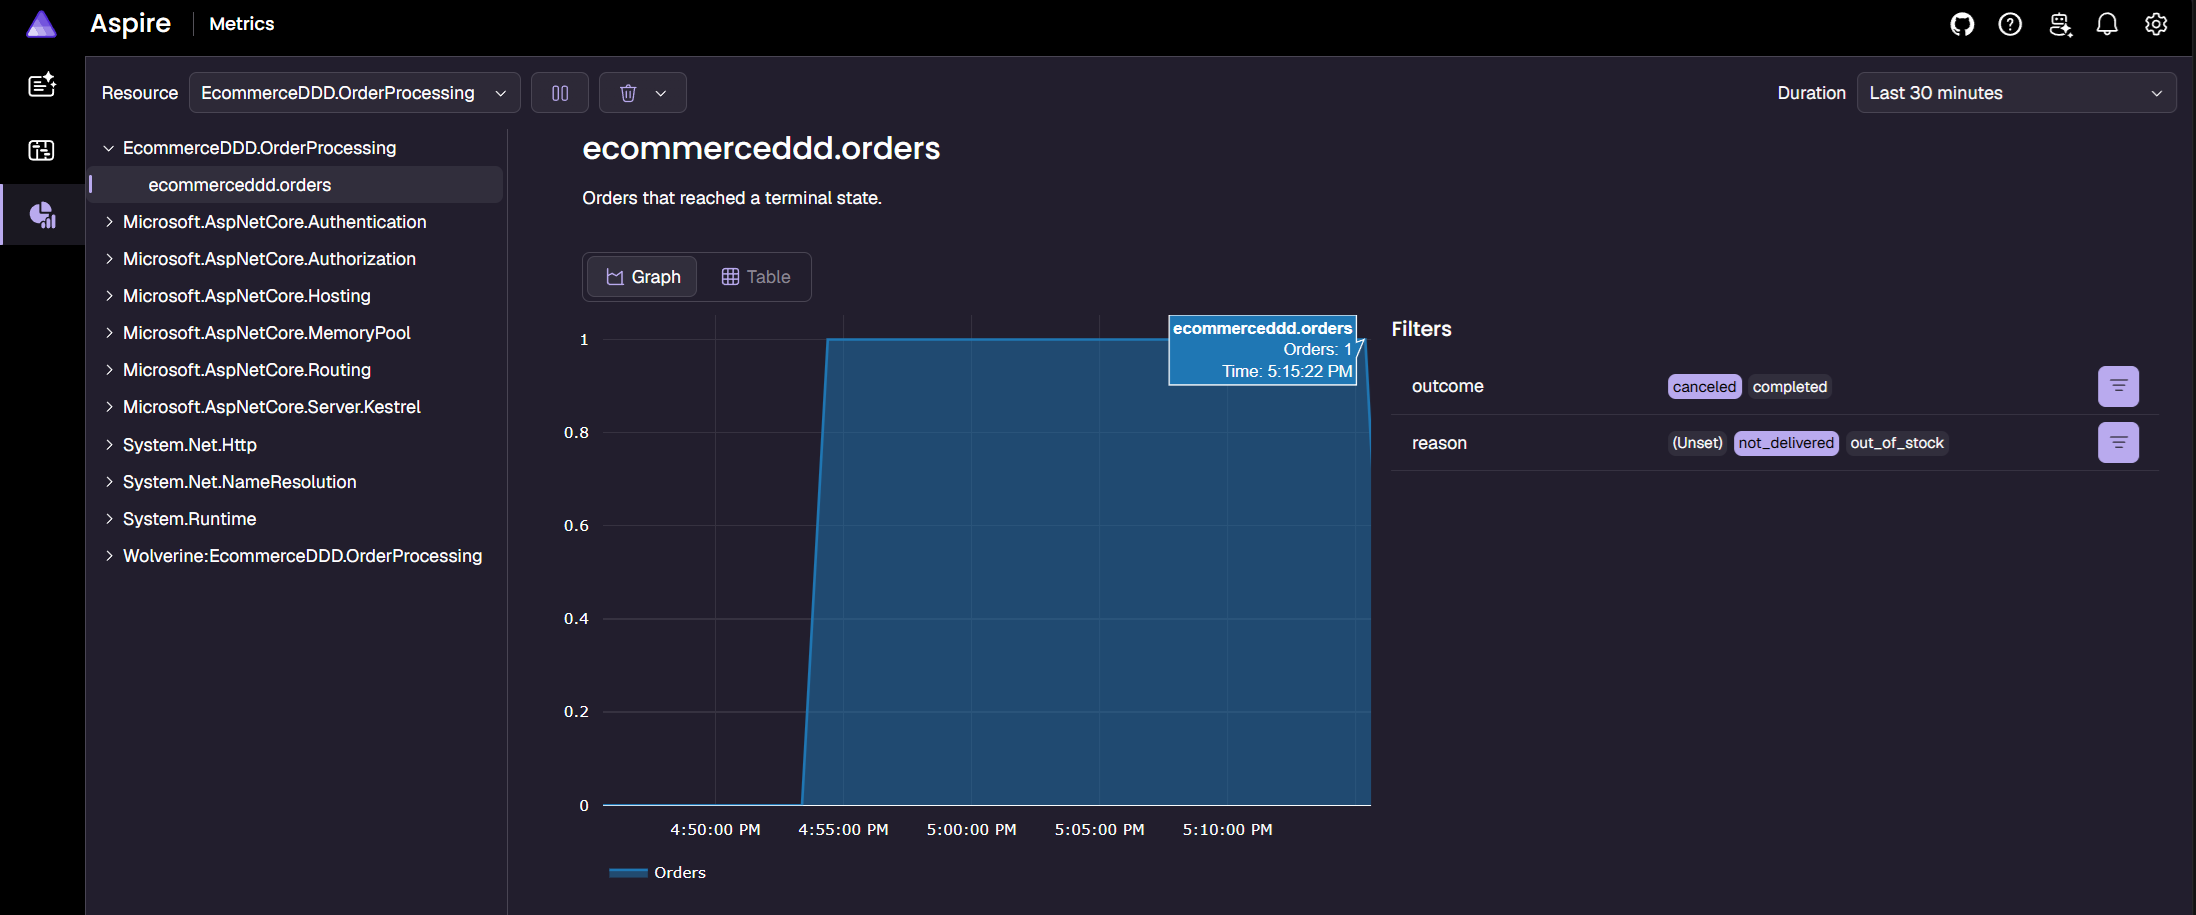
outcome: canceled, reason: out_of_stock
Final thoughts
Across both parts, I followed an order through its happy path, then broke things on purpose to see where each failure shows up in traces, logs and metrics.
In distributed systems with this many moving parts, resilience absorbs the foreseeable failures, and observability lets you see and act on what it can’t. As I always disclaim, everything here is a shape that fits this project, not a prescription of how you should implement observability and resilience techniques in yours.
That said, the concepts are universal and apply to other implementations and stacks. The world of observability is huge and goes way beyond the tooling I showed here. I didn’t cover the many possibilities for alerting, querying and building business-driven dashboards on top of the data OTel collects, and they’re worth a look.
I hope you enjoyed the series. See you in the next post!
Links worth checking
- OpenTelemetry - What is it?
- OTel Messaging Semantic Conventions
- OTel HTTP Semantic Conventions
- .NET Aspire Dashboard
- Npgsql OpenTelemetry Tracing
- Marten - .NET Document and Event Store
- Wolverine - Durability and Outbox
- Wolverine - Instrumentation and Metrics