EcommerceDDD++: Observing an order end-to-end with OpenTelemetry [1/2]
EcommerceDDD++ is a companion series to the original six-part series. Each post covers a meaningful improvement or addition to the EcommerceDDD project that didn’t fit neatly into the original arc.
This time I’ll cover observability. If you followed the six-part series, you know by now that the architecture is distributed across independent services. Even with a central orchestrator, it’s challenging to follow an order through every service it touches.
As I demonstrated when covering the Saga pattern in Part 4 - Persisting Events and implementing Saga, some failures are predictable parts of the business and are resolved through a compensation flow. Others are technical and may interrupt the entire workflow, which is why I mentioned the durable inbox and outbox under Kafka topics + Wolverine in Part 5 - Wrapping up backend infrastructure. In this two-part post, I’ll use observability to follow an order across the entire processing chain, and to see where the technical failures show up.
The three pillars of observability
There are lots of talks and articles about observability in software, and I’ll stick to this definition:
In software engineering, more specifically in distributed computing, observability is the ability to collect data about programs’ execution, modules’ internal states, and the communication among components.
The backbone for observability is defined in OpenTelemetry.
OpenTelemetry (also called OTel) is an open-source framework and toolkit that standardizes how software applications generate, collect, and send performance data.
OpenTelemetry defines three signals that together give you a complete picture of a running system:
- Traces: the end-to-end journey of a request, broken into
spans. Each span represents a unit of work with astart time,duration, andattributes. - Metrics: numeric measurements over time:
request rates,error counts,latency percentiles,memory usage. - Logs: structured text events emitted by your application, correlated to a trace when possible.
Placing an order triggers activity across multiple services, Kafka topics, PostgreSQL, inbox and outbox writes. All three signals are wired in the project, and this first post focuses on traces and the logs correlated to them.
How a trace holds together
- TraceId: identifies the trace, with the same value on every span in the tree.
- SpanId: identifies a single span within the trace.
- ParentSpanId: points to the span this one hangs from. Those pointers form the trace tree.
For a span in one service to join a trace started in another, it needs to know which trace it belongs to and which span called it. The trace context carries exactly that: the TraceId, the caller’s SpanId (which becomes the parent), and sampling flags.
Within a single process, .NET carries it for you in Activity.Current, and every new span picks it up automatically. However, across process boundaries there’s no shared memory, so the context has to travel with the HTTP request or the Kafka message itself. It uses the W3C traceparent format, carried in the traceparent header over HTTP, and in Wolverine’s parent-id header over Kafka:
1
2
00-4bf92f3577b34da6a3ce929d0e0e4736-00f067aa0ba902b7-01
   └─ TraceId ─────────────────────┘ └─ SpanId ─────┘ └ flags
In this project, OrderProcessing is an orchestrator subscribed to two Kafka topics: payments and shipments. In a simplified way, the workflow goes like this:
- Placing an order raises
OrderPlaced, which starts theOrderSaga. It reserves stock atInventoryManagementand requests a payment fromPaymentProcessing, both over HTTP. PaymentProcessingchecks the customer’s store credit atCustomerManagementand writesPaymentFinalizedto its outbox, relayed to thepaymentstopic.- Once the payment is recorded, the saga requests a shipment.
ShipmentProcessingfollows a similar path through theshipmentstopic. - Later, the user confirms delivery from the UI, in a separate request with its own trace. That raises
OrderDeliveredand completes the saga.
There are three types of transport happening here, at different times:
- What is dispatched in-process through Wolverine’s local queues (not Kafka), like the saga steps in
OrderProcessing, or processing a payment right after it’s created. - What travels to other services over HTTP (cross-service direct calls).
- What travels completely asynchronously through Kafka topics (with an outbox on the producing side and a durable inbox on the consuming side).
Each of them carries the trace context in its own way, and the rest of this series is about making all three end up in the same trace:
sequenceDiagram
    actor U as User
    participant OP as OrderProcessing
    participant IM as InventoryManagement
    participant K as Kafka (payments)
    participant PP as PaymentProcessing
    participant CM as CustomerManagement

    U->>OP: PUT PlaceOrder (a new trace starts)
    Note over OP: OrderPlaced → OrderSaga → ProcessOrder<br/>local queue, context on the envelope
    OP->>IM: HTTP stock check and reservation<br/>context in the traceparent header
    Note over OP: OrderProcessed → RequestPayment<br/>local queue
    OP->>PP: HTTP RequestPayment<br/>context in the traceparent header
    Note over PP: payment stored, request answered<br/>PaymentCreated → ProcessPayment<br/>local queue
    PP->>CM: HTTP store credit check<br/>context in the traceparent header
    Note over PP: PaymentFinalized staged in the outbox<br/>in the same transaction
    PP-->>K: after commit<br/>context in the parent-id header
    K-->>OP: durable inbox → OrderSaga<br/>handler span is a child, same TraceId
    Note over OP,K: OrderPaid → RequestShipment. ShipmentProcessing<br/>repeats the path through the shipments topic
Setting up the observability pipeline
All microservices in this project share the same infrastructure via EcommerceDDD.Core.Infrastructure. The entire OTel setup lives in the AddOpenTelemetryObservability extension method, called from CoreInfrastructureExtensions.cs:
A few design decisions:
.ConfigureResource()makes all signals carry the sameservice.nameandservice.versionattributes without duplication..WithTracing()collects the traces pillar.AddAspNetCoreInstrumentation()andAddHttpClientInstrumentation()turn every inbound request and outbound HTTP call into a span, and the two sources below add database and Wolverine spans on top. The/healthprobes Docker fires periodically are filtered out, since each would otherwise be a trace of its own..AddNpgsql()(from theNpgsql.OpenTelemetrypackage) instruments every database query automatically. You get the duration and database metadata, and the query is attached to the active trace as a child span. Marten sits on top of Npgsql, so its queries are traced the same way.There’s a catch: Wolverine’s durability agents poll the database every few seconds, and each poll becomes a trace of its own, crowding out the order traces. Wolverine’s node health check does the same, so its tracing is turned off (
NodeAssignmentHealthCheckTracingEnabled = false). For the polling, Npgsql lets you choose which commands to trace, so the data source in MartenConfigExtension.cs only traces queries issued while something is being handled:1 2 3 4 5 6
var dataSource = new NpgsqlDataSourceBuilder(connectionString) .ConfigureTracing(tracing => tracing .ConfigureCommandFilter(_ => Activity.Current is not null) .ConfigureBatchFilter(_ => Activity.Current is not null) .EnablePhysicalOpenTracing(false)) .Build();
.AddSource(ActivitySources.Wolverine)subscribes to Wolverine’s ownActivitySource, so every command, query and event handler gets a span with no manual plumbing..AddOtlpExporter()ships the spans using OTLP (OpenTelemetry Protocol), its vendor-neutral wire protocol. With no arguments, it reads the endpoint from theOTEL_EXPORTER_OTLP_ENDPOINTenvironment variable (check the docker-compose.yml) and defaults to gRPC.- No sampler is configured, so the default
ParentBased(AlwaysOn)records every trace. That’s fine for a dev stack, but costly at volume with a paid backend.
.WithMetrics()collects the metrics pillar: ASP.NET Core and HttpClient instrumentation (as in tracing),.NET runtimemetrics such asGC(Garbage Collection) and thread pool usage, plus Wolverine’s meter and the service’s own meter..WithLogging()collects the logs pillar. An OTLP exporter is added, along with a processor that copies the order id onto log records (more on that below). The OTel logging provider plugs intoILogger<T>and exports its records. When emitted within an active span, they carry theTraceIdandSpanIdautomatically.
Services that don’t use CoreInfrastructureExtensions, like the API Gateway, can call it directly:
1
services.AddOpenTelemetryObservability("EcommerceDDD.ApiGateway");
Of the OTel packages in Directory.Packages.props, Npgsql.OpenTelemetry is maintained by the Npgsql team, so its major version must match your Npgsql version.
The Aspire Dashboard as a collector
This project uses the .NET Aspire Dashboard as a standalone OTLP collector and UI. It’s a single Docker container that accepts traces, metrics, and logs over OTLP/gRPC. Like other infrastructure, I added its container in docker-compose.infra.yml:
1
2
3
4
5
6
7
aspire-dashboard:
  image: mcr.microsoft.com/dotnet/aspire-dashboard:13.5
  ports:
    - '18888:18888'
  environment:
    ASPIRE_DASHBOARD_UNSECURED_ALLOW_ANONYMOUS: 'true'
  restart: on-failure
And each service configured in docker-compose.yml sends telemetry to it via the standard OTLP endpoint:
1
2
3
4
5
x-dotnet-service: &dotnet-service
  environment:
    ASPNETCORE_ENVIRONMENT: '${ASPNETCORE_ENVIRONMENT:-Development}'
    ASPNETCORE_URLS: 'http://+:80'
    OTEL_EXPORTER_OTLP_ENDPOINT: 'http://aspire-dashboard:18889'
The dashboard is accessible at localhost:18888 and requires no additional configuration.
⚠️ Only 18888 is published to the host. The OTLP ingestion port 18889 is reachable on the Docker network, which is all the containerized services need. If you run a service directly from your IDE, while the rest of the stack is in Docker, publish that port too or the telemetry silently goes nowhere.
What the Aspire Dashboard is and isn’t
The Aspire Dashboard is a real-time visualizer for active development, allowing you to view and filter traces, correlated logs and metrics in one place. However, all its data is stored in memory with finite per-signal buffers (10,000 traces and 10,000 log entries by default). As new telemetry arrives, older entries are evicted, so a deep-link to a specific trace that worked earlier may return “No traces found”, even without a container restart.
These caps are configurable. If you want longer debugging sessions before eviction, raise them on the dashboard container (it’s still in memory, so it costs RAM and nothing survives a restart):
1
2
3
4
environment:
  DASHBOARD__TELEMETRYLIMITS__MAXTRACECOUNT: '50000'
  DASHBOARD__TELEMETRYLIMITS__MAXLOGCOUNT: '50000'
  DASHBOARD__TELEMETRYLIMITS__MAXMETRICSCOUNT: '100000'
I left the project on the defaults, so a fresh clone doesn’t blow up the RAM of whoever just wants to run it.
💡 For historical lookup and retention, you would need a dedicated backend, which is out of scope for now. Some options, by signal:
- Traces: Jaeger or Grafana Tempo.
- Logs: Loki or Seq.
- Metrics: Prometheus.
- All-in-one: SigNoz or OpenObserve, covering the three signals in one place.
Types of errors
The ASP.NET Core instrumentation already marks a server span as errored when the response is a 5xx (server error), although it doesn’t attach the exception itself. Recording an exception on a span is an explicit call, and the GlobalExceptionHandler centralizes it:
The span status follows the OTel conventions. Which failures become 4xx or 5xx, which log level they get and whether the exception is attached are the project’s design choices:
- 5xx server errors (unhandled exceptions): the span is marked as
Error, the full exception stack is attached viaAddException, and the log entry carriesLogLevel.Error. This makes the span appear red in the dashboard. - 4xx client errors (domain validation, business rules): the span status is left unset and the log level is
Warning. The OTel HTTP conventions say a 4xx must leave the server span status unset, reservingErrorfor the client side, so the same404(Not Found) or422(Unprocessable Entity) still shows red on the caller’sHttpClientspan (theApiGateway, or a service calling another). The response is still visible through thehttp.response.status_codeattribute and the correlated warning log.
Not every failure is an exception, though. Handlers return FluentResults Results, and a failed one never reaches the GlobalExceptionHandler. Instead, CustomControllerBase maps it to a ProblemDetails response by error type:
RecordNotFoundErrorbecomes404.ValidationErrorbecomes422.ForbiddenErrorbecomes403(Forbidden).- Anything else becomes
500(Internal Server Error).
It logs them at the same levels as the exception path: Warning for 4xx, Error for 5xx.
Also, traceId is included in every error body the services return, from both paths. When a user reports an error, you have the exact trace identifier to look up in the dashboard.
Tagging business context with OrderId
Tags (called attributes in OTel terms) are key/value pairs attached to a span, like http.request.method or db.system.name. Instrumentation libraries usually add the standard ones, but you can add your own to describe what the span means to the business.
A tag belongs only to the span it was set on. Child spans created afterwards, such as Npgsql queries or outgoing HTTP calls, sit under it in the trace tree but don’t inherit its tags.
I want traces to be searchable by a key that means something to the project: the order.id, named in OpenTelemetry’s lowercase, dot-separated style.
The SPA (Single Page Application) generates the order id up front, so PlaceOrder already has it.
From there, every command or event carrying an OrderId gets it tagged as order.id on its handler span. Following Wolverine’s conventions, I would mark the OrderId of each message with an [Audit] attribute. Instead, I applied it globally with OrderIdTagPolicy, a Wolverine chain policy. It also replaces the OrderId tag Wolverine puts on saga messages, so the filter key stays consistent.
💡 Why not baggage? It carries context that downstream services don’t have. Every order message already carries its OrderId, so I tag it straight from there.
Every trace of that order can then be filtered in the Aspire Dashboard by order.id:equals:{guid}. The filter matches traces containing a span with that attribute. Calls that don’t carry the order id still appear inside those traces, just without the tag.
⚠️ Opening a quote and adding items happen in the cart, before the order exists. Only ConfirmQuote, sent while the order is processed, carries the OrderId, so the earlier cart traces aren’t matched by this filter.
What you see in the dashboard
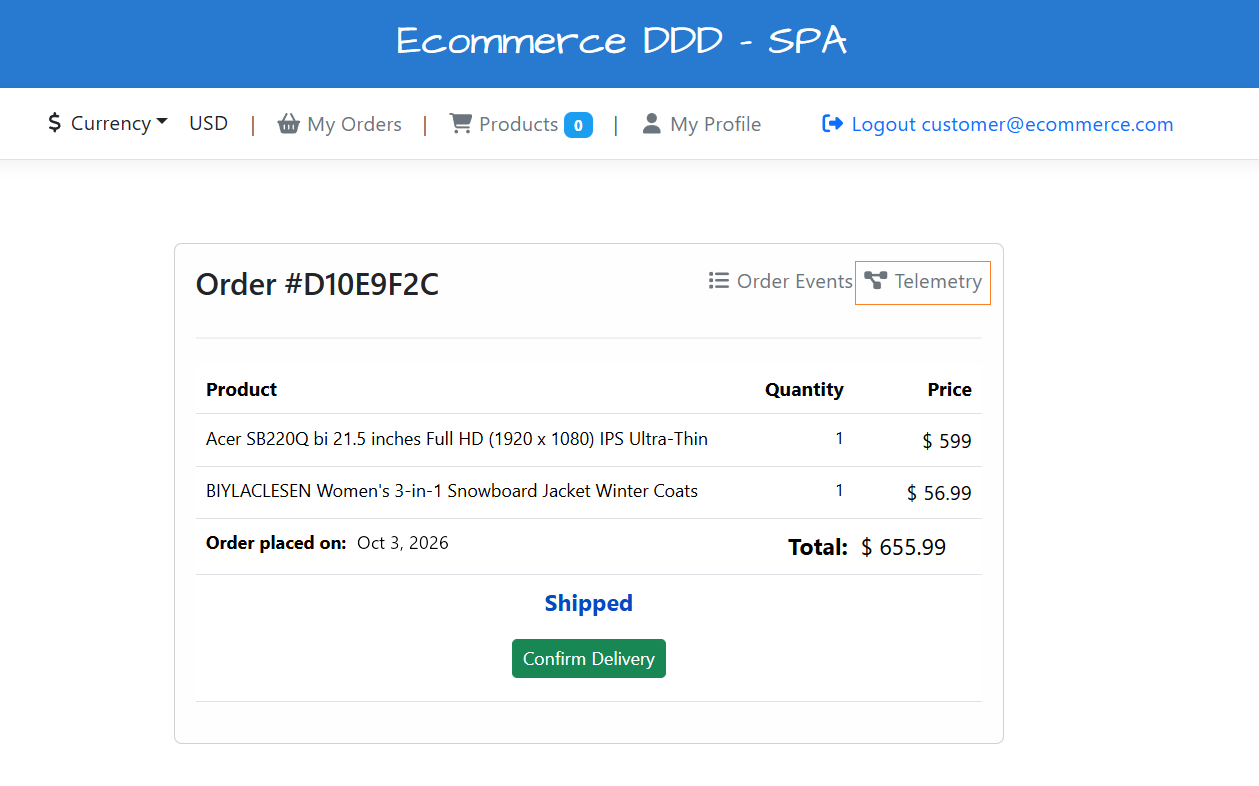
Once the stack is running (docker compose --profile frontend up), each order in the SPA’s Orders list shows a “Telemetry” link that deep-links to its traces in the Aspire Dashboard, using that filter:
Traces
First request - Order Placed
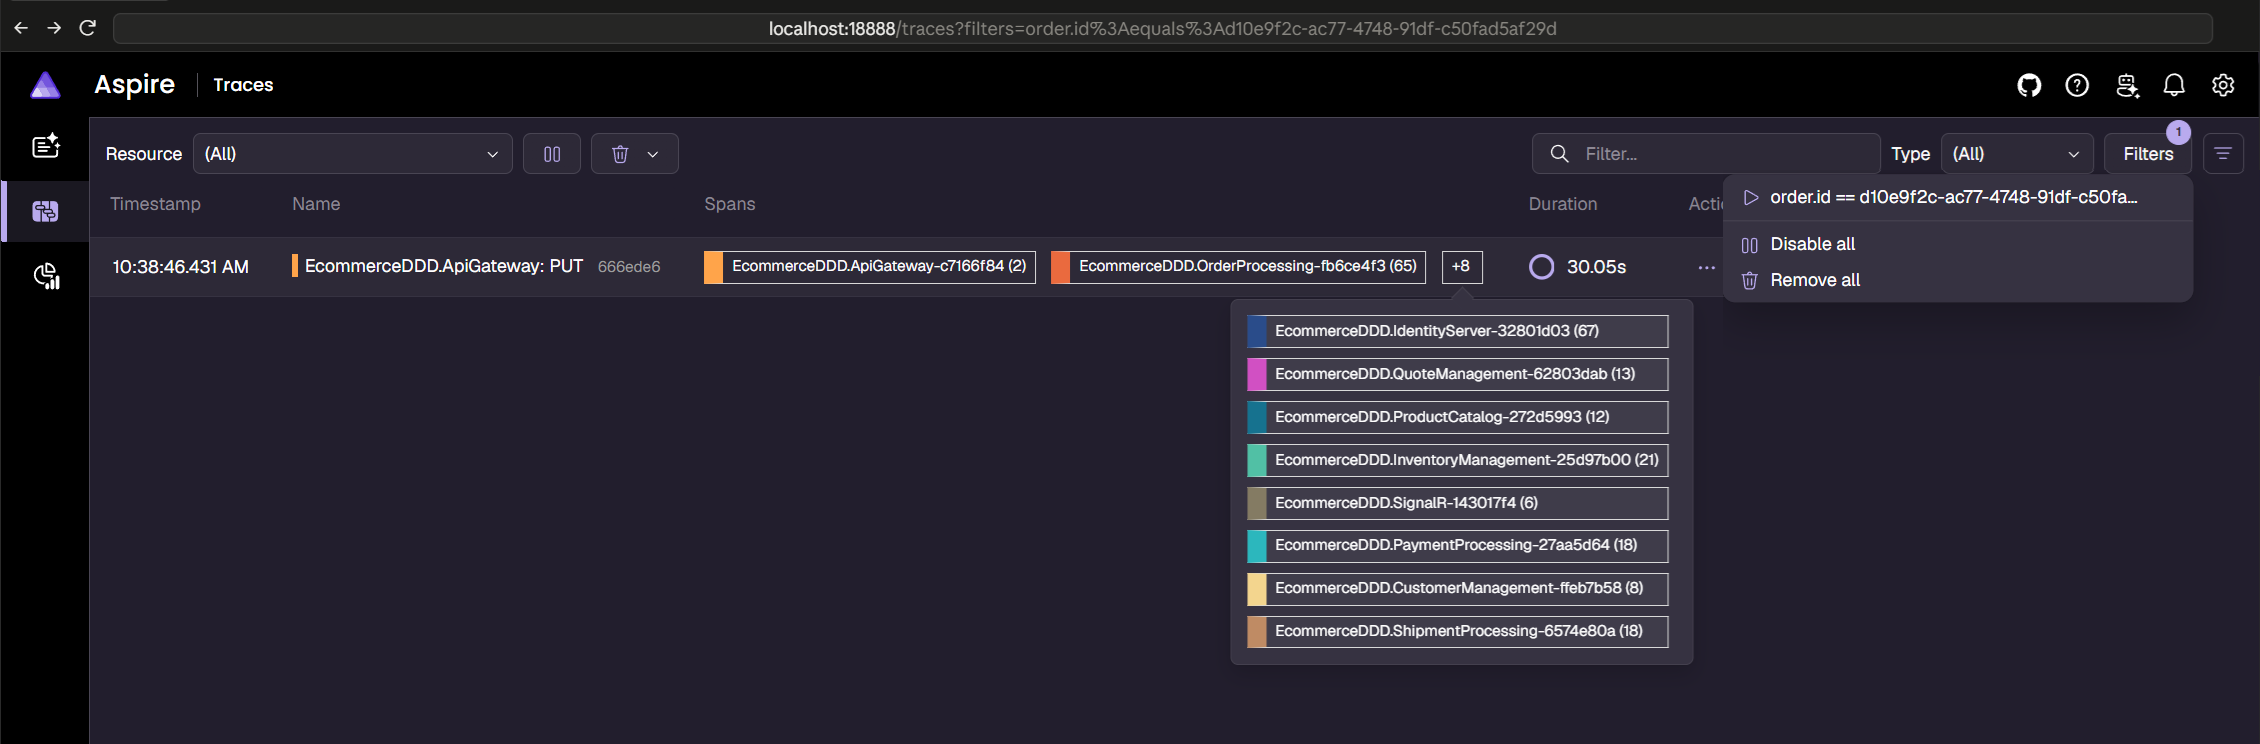
The first trace for the order.id fans out across every service the order touched, from the ApiGateway and the OrderProcessing orchestrator to the payment and shipment services and the ones they call along the way.
💡 The duration is the entire asynchronous journey through Kafka, not how long the user waited for the 200 (OK) returned by PlaceOrder. A few handlers also pause on purpose, so each step is visible in the SPA.
Second request - Delivery Confirmed
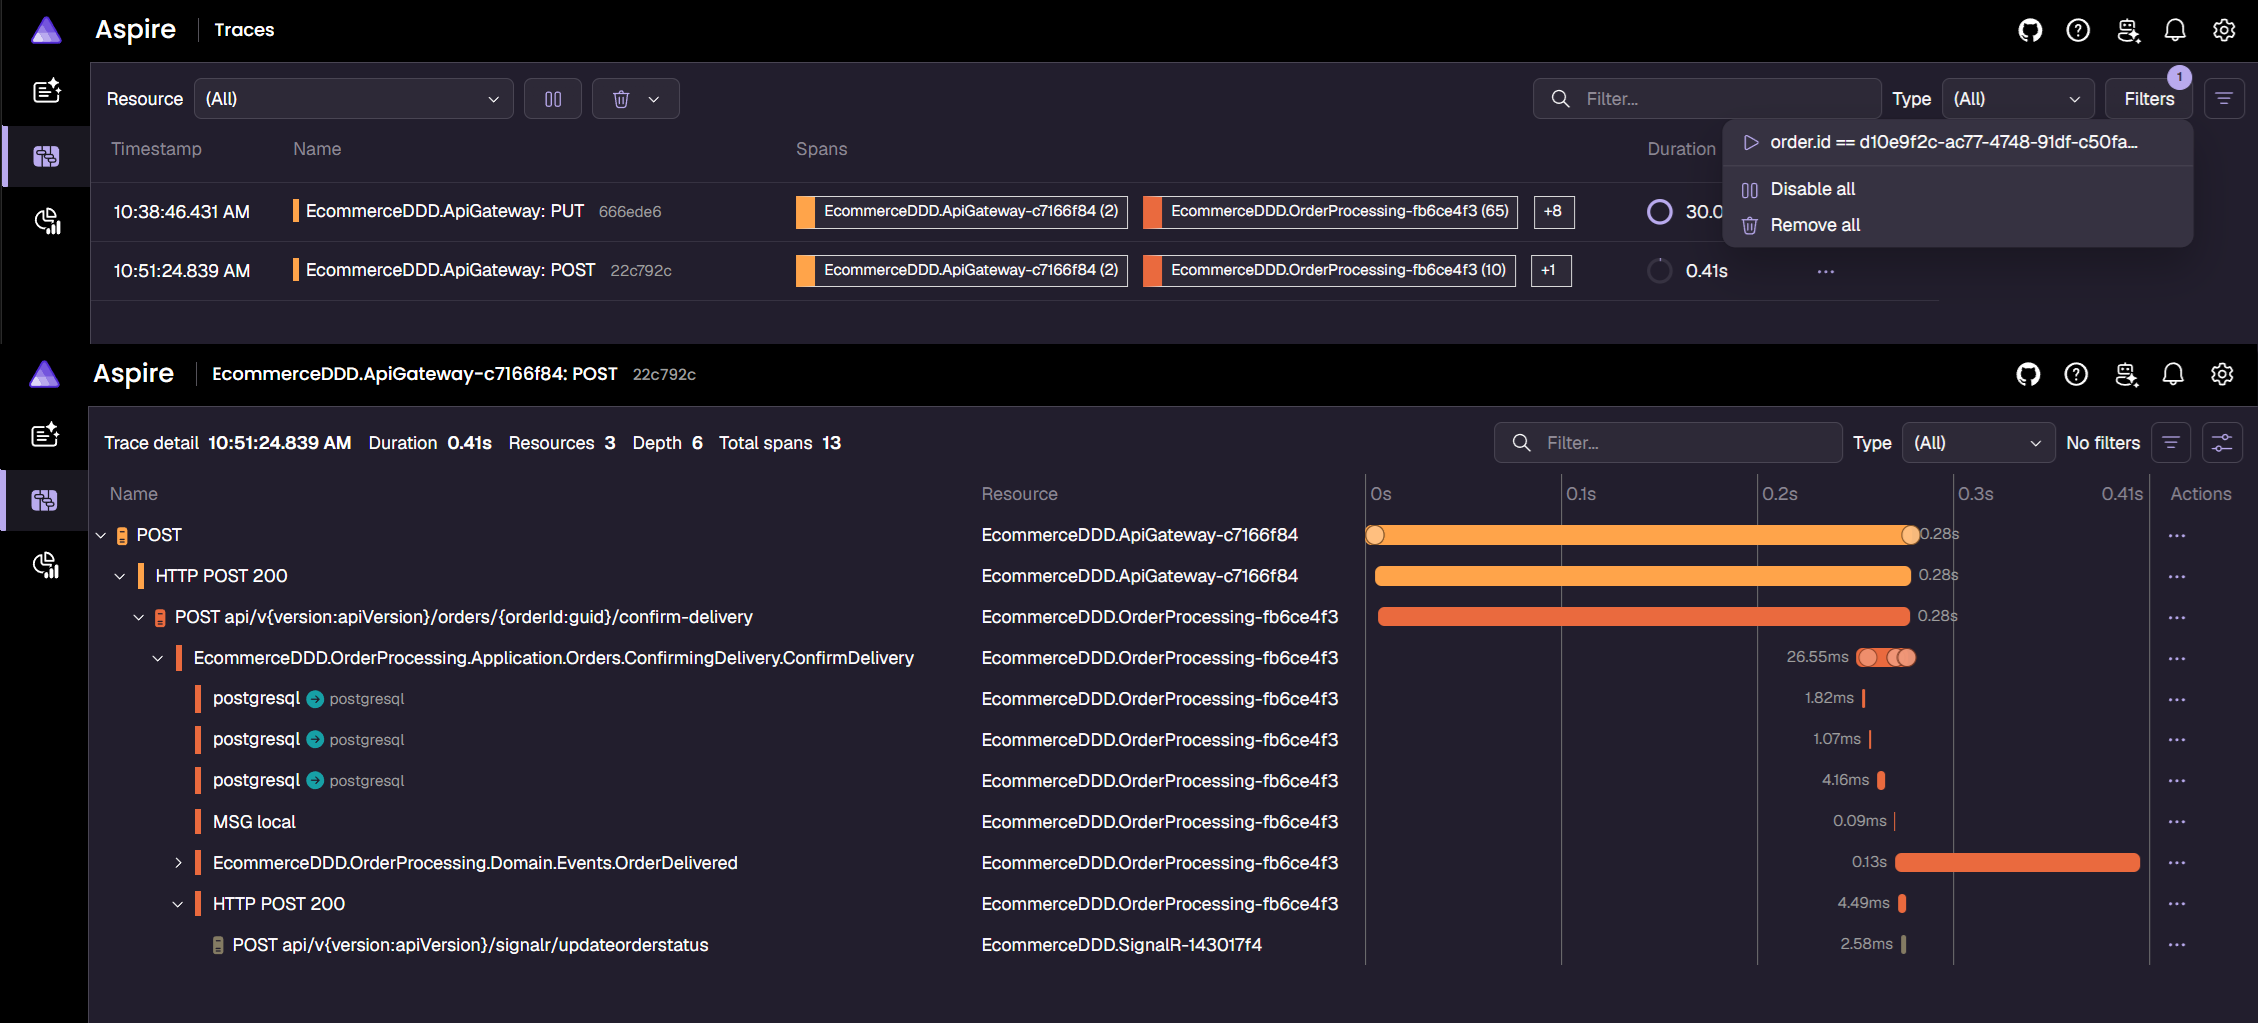
After the user clicks Confirm Delivery, the trace is much shorter. The ApiGateway forwards the POST, OrderProcessing handles ConfirmDelivery and saves the change (you can see Npgsql instrumenting itself), and a SignalR call pushes the new status to the SPA. In the middle, the MSG local span is OrderDelivered going to the saga through Wolverine’s local queue. It never leaves the process, yet it’s still part of the same trace.
Logs
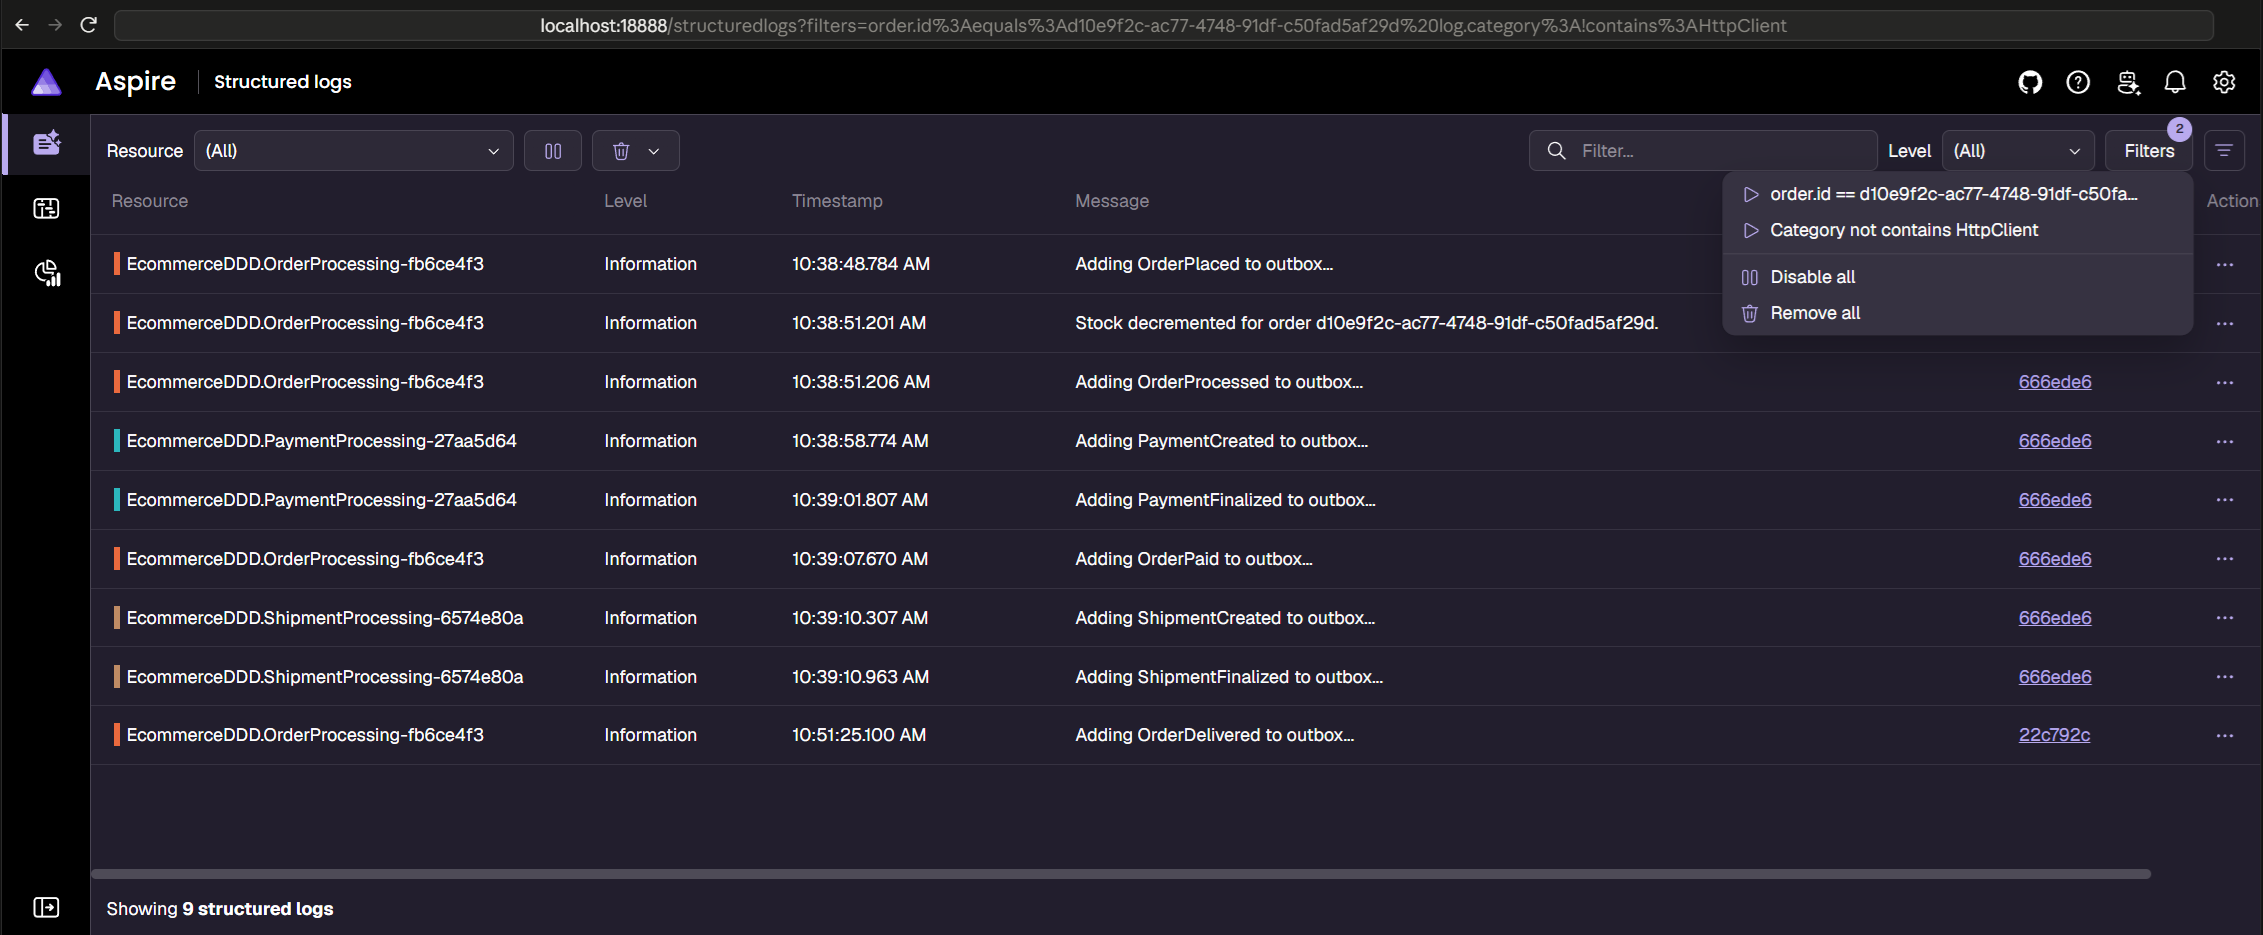
The same order.id reaches the logs. OrderIdLogProcessor copies it from the active span onto every log record written inside an order’s handlers, so filtering the structured logs by order.id returns the order’s logs across services and traces. Logs written outside those handlers don’t carry it, but they share the TraceId with the rest of the request. Here the HTTP client logs are filtered out too, leaving mostly the events each service added to its outbox.
What’s next
In Part 2, I’ll break things on purpose, with a broker outage and a downstream service going down, and look at what the traces and logs show across the outbox and the Kafka hop. I’ll also cover metrics, from Wolverine’s failure counts to a business metric for orders. See you there!
Links worth checking
- OpenTelemetry - What is it?
- OTel Messaging Semantic Conventions
- OTel HTTP Semantic Conventions
- .NET Aspire Dashboard
- Npgsql OpenTelemetry Tracing
- Marten - .NET Document and Event Store
- Wolverine - Durability and Outbox
- Wolverine - Instrumentation and Metrics